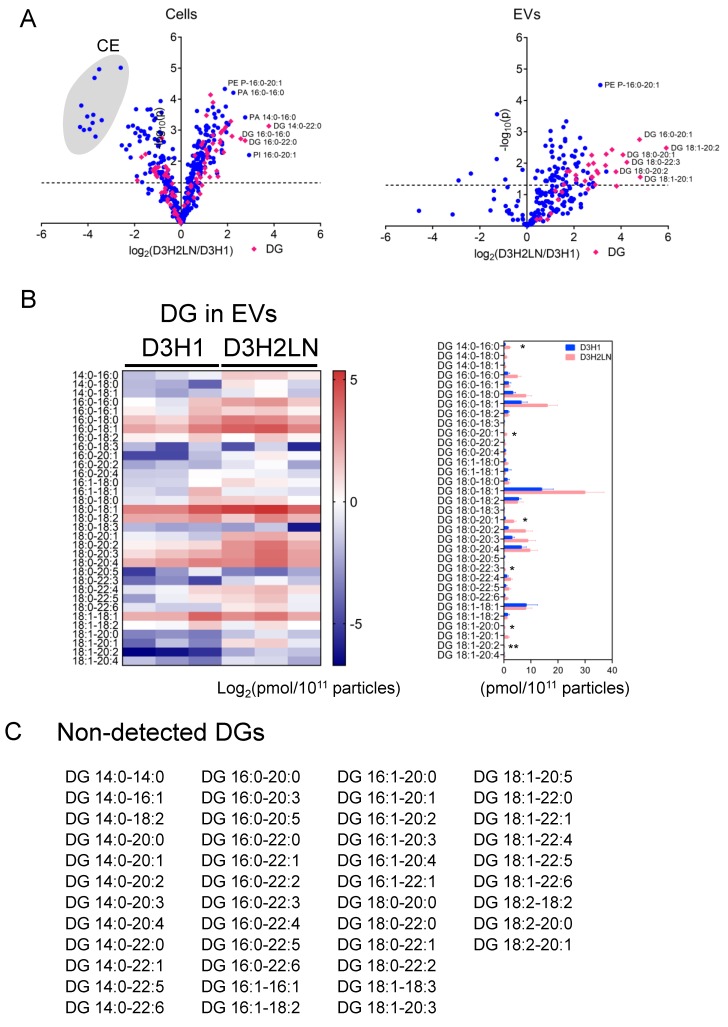
Figure 3.
Comparison of individual lipid species between D3H1 and D3H2LN in cells and EVs. (A) Volcano plots of fold changes of individual lipid molecules between D3H1 and D3H2LN based on mol percentile to the total detected lipids. Left: cells, Right: EVs. p-value was analyzed by an unpaired two-tail Student’s t-test. The plots marked in pink diamonds are DGs. (B) (Left) A heatmap of log-based mol quantities of DG species in EVs of D3H1 and D3H2LN, normalized by particle number of EVs. Each column indicates the measurement from three independent samples. (Right) Mol quantity of DGs normalized to particle number of EVs from D3H1 and D3H2LN. The bar graphs indicate mean ± SEM. (C) A list of DG species not detected in both D3H1 and D3H2LN EVs. *** p < 0.001, ** p < 0.01, * p < 0.05, Student’s t-test (unpaired, two-tailed).

