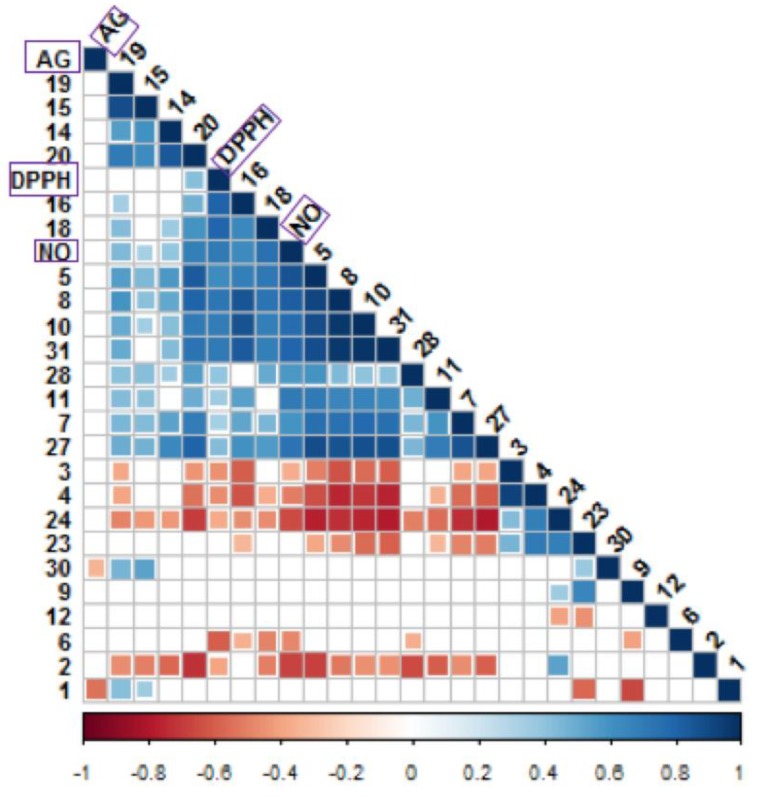
Figure 5.
Correlogram visualizing correlation between metabolites analyzed using 1H NMR and biological activities. Correlation with p-value > 0.05 are considered insignificant and are represented by the blank white space. Color and size of the squares are proportional to the correlation coefficients. Positive correlations are shown in blue (different shades; dark blue with the strongest correlation) whereas negative correlations in red (ranging from light red to red; dark red with the weakest correlation). Assignment of metabolites: 1, fructose; 2, sucrose; 3, α-D-glucose; 4, β-D-glucose;6, arginine; 5, alanine; 7, asparagine; 8, threonine; 9, glycine; 10, valine; 11, isoleucine; 12, phenylalanine; 13, tryptophan; 14, citric acid; 15, malic acid; 14, citric acid; 15, malic acid; 16, α-linolenic acid; 17, ferulic acid; 18, gallic acid; 19, epicatechin; 20, catechin; 23, vanillic acid; 24, syringic acid; 27, succinic acid; 28, glyceric acid; 31, 3-methylglucaric acid.

