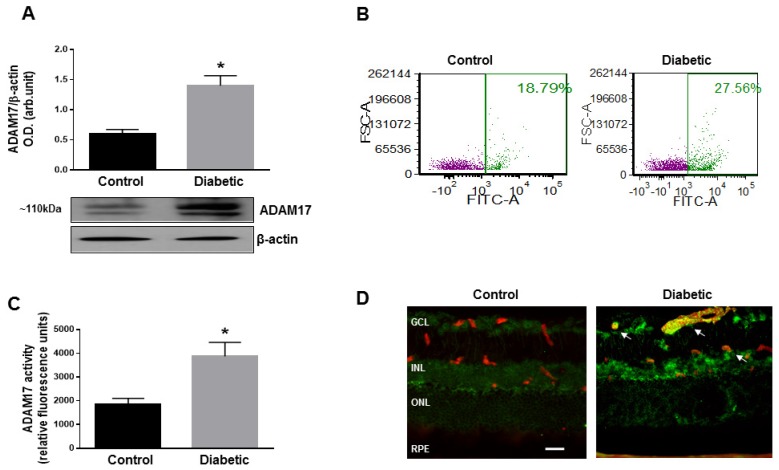
Figure 2.
ADAM17 expression in the mouse retina. (A) Representative blots and densitometry analysis of ADAM17 expression in normoglycemic (control) and diabetic C57Bl/6J mice (diabetic) mice at 8 weeks of diabetes. Data presented as mean ± standard error (SE). * p < 0.01. n = 5 per group. (B) Flow cytometric analysis of cell surface expression of ADAM17 in retinal single cell suspension from control and diabetic C57Bl/6J mice at 8 weeks of diabetes. n = 3 pooled retinas per group. (C) ADAM17 enzyme activity measured by fluorimetric assay in control and diabetic retinas of C57Bl/6J mice. Data presented as mean ± SE. * p < 0.01. n = 5 per group. (D) Representative images of ADAM17 specific immunoreactivity (green) in retinas of control and diabetic C57Bl/6J mice at 8 weeks of diabetes. Anti-CD31 antibody (red) was used to co-label endothelial cells. Arrows indicate coexpression of ADAM17 and CD31. GCL, ganglion cell layer; INL, inner nuclear layer; ONL, outer nuclear layer; RPE, retinal pigment epithelial cells. Scale bar, 50 µm.

