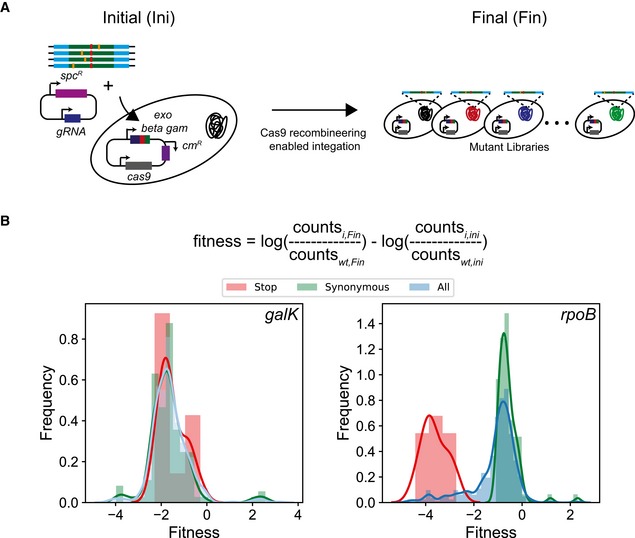
Figure EV2. Identification of deleterious substitutions using CREPE .

- We compared the frequency of variants efficiency before (Initial, ini) and after (Final, fin) integration on the genome.
- Distribution of fitness estimates for integration of the donor (using the fitness equation as highlighted in the text) for the galK (left), and rpoB (right) for non‐synonymous (blue with blue line), synonymous mutations (green with green line), and stop codon (red with red line) substitutions.
