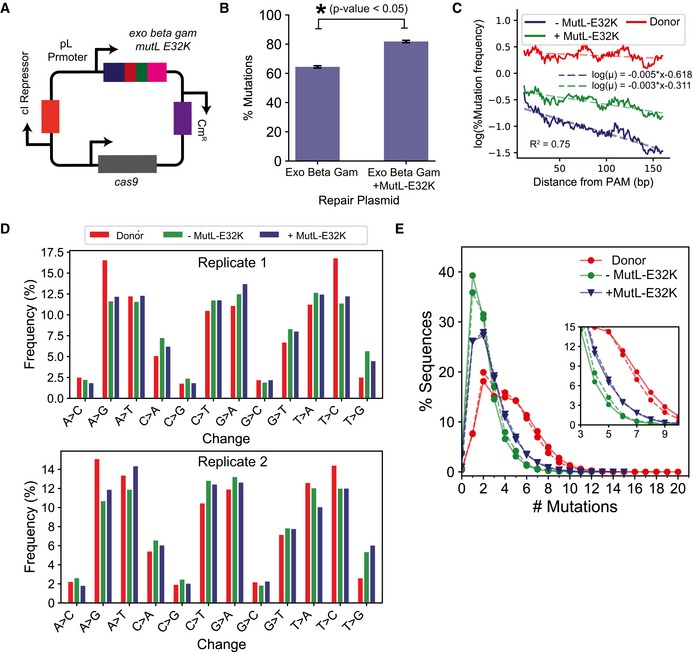
Figure 3. Impact of blocking methyl‐directed mismatch repair (MMR) on mutation efficiency.

- Plasmid map where the mutL‐E32K gene was placed under the temperature‐inducible pL promoter in the lambda recombination operon as described by Nyerges et al (2016).
- Comparison of % mutation efficiency determined by deep sequencing the genome after integrating high‐diversity donor in the presence and absence of MutLE32K. Significant changes, determined as P‐value < 0.05 for 1‐tailed Student's t‐test, are demonstrated using the *. Each value represents the mean, and error bars represent the standard deviation for biological replicates.
- Comparison of change in mutation frequency per base (%) and percentage of sequences with a mutation at the position, using the high‐diversity donor, are represented as rolling mean over 10 bases versus the distance from the PAM (base pairs) for recombination in the presence (blue) and absence (green) of MutLE32K. The dashed lines represent an exponential decay model fitted to quantify the decrease in mutation frequency with distance from PAM. The equations on top represent the fitted equation, and the R‐squared value is the lower R‐squared value of the 2 fits.
- Comparison of percentage occurrence of individual base change combinations between the high‐diversity donor (red) and the genome after recombination in the presence (blue) and absence (green) of MutLE32K. The bars represent mean percentage occurrence for individual base changes, and error bars represent the standard deviation for two biological replicates of next‐generation sequencing data.
- A comparison of percentage sequence variants categorized by the number of mutations (x‐axis) between the high‐diversity donor before (red) and after genome integration in the presence (blue) and absence (green) of MutLE32K. The inset highlights percent of sequences with 3–9 mutations in addition to the SPM. #Mutations = 1 corresponds to sequences with only the SPM. The experiments were performed in biological replicates. The trends for the replicates are represented by solid (—) and dashed (‐‐) lines, respectively.
