
Figure 5. CREPE‐mediated mutagenesis of rpoB for resistance to rifampicin.
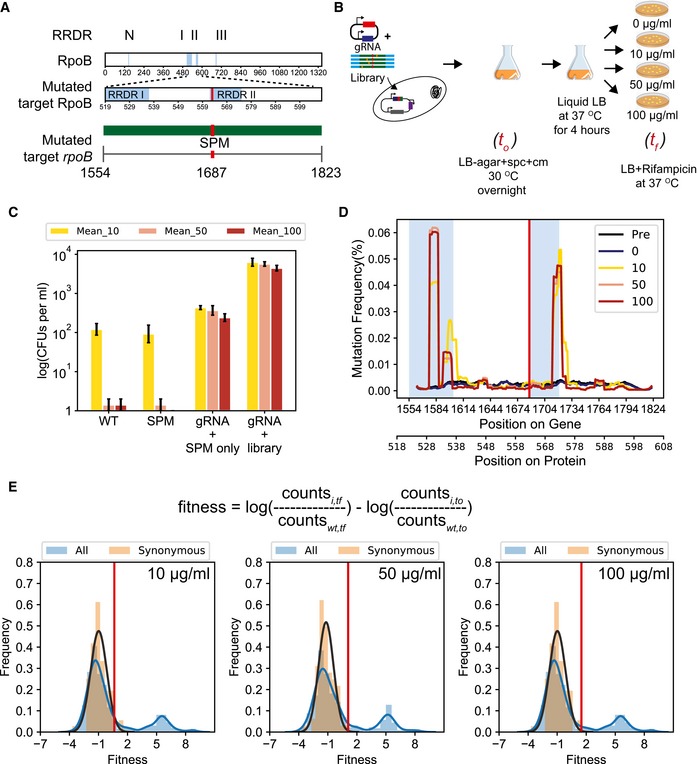
- Four distinct regions within rpoB (N, I, II, and III) are rifampicin resistance‐determining regions (RRDRs). We used CREPE to make a library covering a 270‐bp‐long region in rpoB covering half of RRDR I and entire RRDR II.
- Experimental setup for studying resistance to 3 different concentrations of rifampicin (10 μg/ml (yellow), 50 μg/ml (pink), and 100 μg/ml (red)) (Materials and Methods).
- (Left to right) Cell growth determined as log(number of colony‐forming units or CFUs per ml of culture) after growth on LB agar with different concentrations of rifampicin, 10 μg/ml (yellow), 50 μg/ml (pink), and 100 μg/ml (red), for wild‐type Escherichia coli MG1655 (WT), a single colony of E. coli MG1655 + synonymous PAM mutation (SPM), a library of colonies recovered by scraping colonies developed after transforming cells with the rpoB targeting gRNA and only the SPM mutation (gRNA + SPM only), and with the rpoB targeting gRNA and only the rpoB error‐prone PCR library (gRNA + library) (see Materials and Methods for details). The bars represent mean percentage occurrence for individual base changes, and error bars represent the standard deviation for three biological replicates.
- The change in mutation frequency per base, fraction of sequences with a mutation at the position, represented as rolling mean over 10 bases along the length of the targeted region for the cells with the rpoB genomic error‐prone PCR library at different concentrations of rifampicin, 10 μg/ml (yellow), 50 μg/ml (pink), and 100 μg/ml (red). The blue windows cover RRDR I and RRDR II in the target region as described in Fig 5A.
- Distribution of fitness estimates for all mutations in the rpoB library (blue with blue line) and only synonymous mutations (salmon with the black line representing a fit for the normal distribution to estimate the mean and standard deviation of the distribution of fitness effects) in the rpoB library at different concentrations of rifampicin, 10 μg/ml (left), 50 μg/ml (center), and 100 μg/ml (right). The red vertical line indicates the threshold for fitness ≥ 2.96 times the standard deviations from the mean fitness of synonymous mutations.