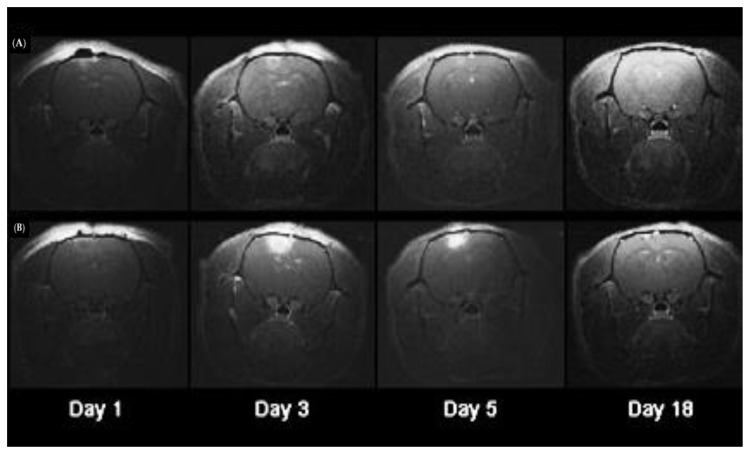
Figure 5.
Comparison of T1-weighted post contrast MRI scans after PDT and PCI treatment. (A) The PDT treated animal received a light fluence of 1 J; (B) the PCI treated animal received a light fluence of 1 J and an i.p. injection of Cl p at a concentration of 1:100. Both animals were scanned on days 1, 3, 5 and 18 after treatment. All T1 post contrast images were taken 15 min following i.p. contrast injection.

