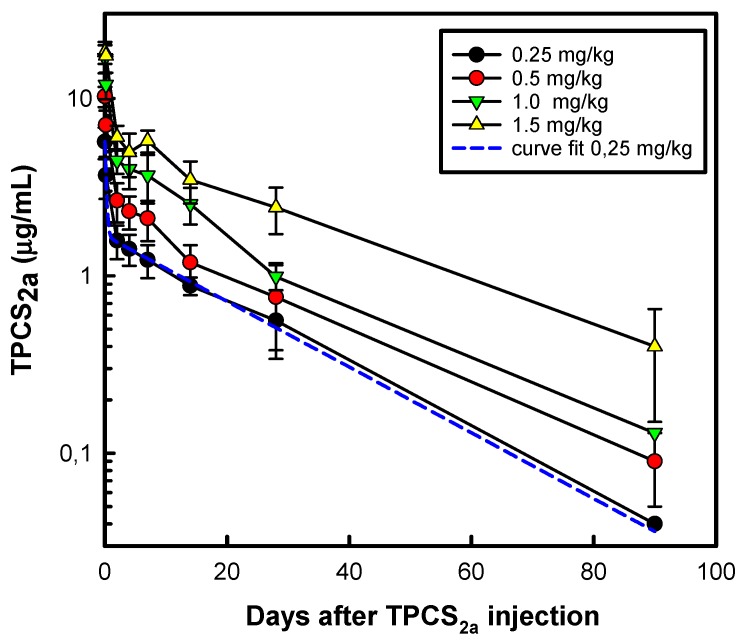
Figure 12.
Pharmacokinetic analyses of plasma concentration of TPCS2a. The concentration of TPCS2a in plasma samples from patients in the dose cohorts 0.25–1.5 mg/kg was analyzed by fluorescence spectroscopy. The excretion rate of TPCS2a in the 0.25 mg/kg cohort that was regarded as the optimal treatment dose was found to fit well a two-compartment model: f(x) = 4.43e−4.71x + 1.69e−0.69x (R2 = 0.99) as presented in the figure. The figure is modified from previously presented results [106]. Error bars show SD.

