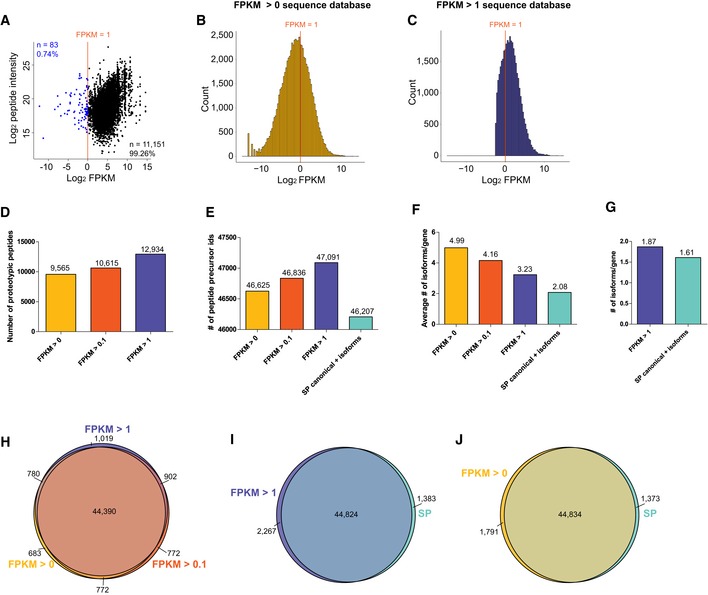
Figure EV1. Quantitative comparison of results acquired with different protein FASTA DB.

-
ADetectability of unique peptides translated from very low‐abundant transcripts (blue dots) expressed below a FPKM of 1 (red line). The mRNA data were analyzed using the FPKM > 0 FASTA DB in fourteen HeLa DIA files.
-
B, CAverage log2 FPKM distribution of transcripts included in the FPKM > 0 (B) and FPKM > 1 (C) databases.
-
D, ENumber of unique (proteotypic) peptides (D) and peptide precursors (E) quantified using FASTA DB with different FPKM cutoffs.
-
FAverage number of alternative splicing isoforms (transcript IDs) per gene ID included in the FASTA DB.
-
GAverage number of alternative splicing isoforms per gene ID quantified using indicated FASTA DB.
-
H–JOverlap between peptide precursor IDs quantified using indicated FASTA DB.
