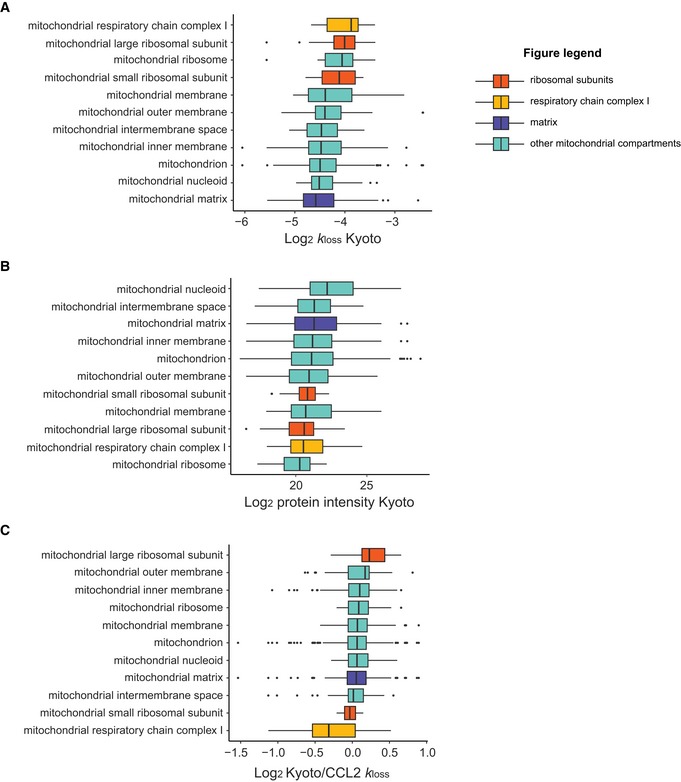
A–CAbsolute‐scale k
loss (A), absolute‐scale protein intensity (B), and relative‐scale k
loss (C, i.e., log2 FC Kyoto/CCL2) distributions for proteins included in the selected gene ontology categories (GOCC) related to mitochondria are depicted. Examples discussed in the main text are highlighted with distinctive colors. Box borders represent the 25th and 75th percentiles, bar within the box represents the median, and whiskers represent the minimum and maximum value within 1.5 times of interquartile range. n = 14, 29, 13, 11, 13, 32, 31, 156, 393, 28, and 127, from to bottom as sorted in (A).

