-
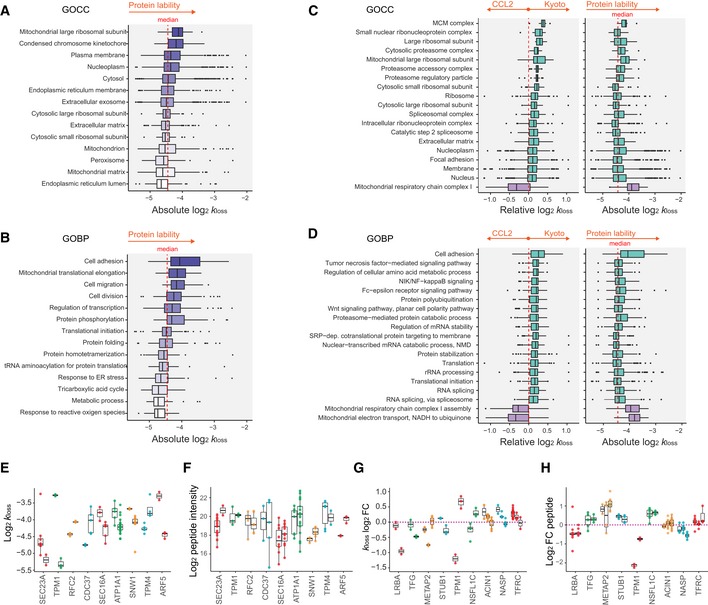
A, B
Distribution of absolute k
loss values (HeLa average) as a function of cellular localization (A, GOCC, n = 29, 23, 325, 770, 889, 146, 798, 49, 82, 35, 393, 25, 127, and 44, from top to bottom) or biological functions (B, GOBP, n = 34, 49, 23, 82, 128, 36, 114, 93, 25, 29, 22, 21, 35, and 17, from top to bottom); the color intensity gradient highlights the increase in protein degradation rate.
-
C, D
Differential degradation (k
loss log2 FC) of GOCC (C, n = 7, 10, 9, 7, 29, 16, 11, 35, 113, 49, 52, 84, 60, 82, 770, 179, 643, 936, and 14, from top to bottom) and GOBP (D, n = 34, 40, 37, 41, 47, 52, 43, 60, 64, 79, 86, 37, 135, 148, 114, 75, and 132, from top to bottom) between HeLa Kyoto and CCL2 (1D enrichment test, P < 0.05). The second panel shows absolute log2
k
loss values matched to the selected examples.
-
E
Absolute peptide k
loss (CCL2 average) distribution of differentially degraded AS isoforms of the same gene (t‐test P < 0.05, mean log2 FC > 0.32).
-
F
Absolute peptide intensities of AS isoforms matching to (E).
-
G
Relative peptide k
loss (Kyoto/CCL2 FC) distribution of differentially degraded AS isoforms of the same gene (t‐test or ANOVA P < 0.05, mean log2 fold difference > 0.32, Tukey test for pairwise comparisons).
-
H
Distribution of HeLa Kyoto/CCL2 peptide intensity log2 FC matching to examples in (G). The number of values is represented by the number of dots.
percentiles, bar within the box represents the median, and whiskers represent the minimum and maximum value within 1.5 times of interquartile range. The dashed red line indicates zero or median as indicated.

