-
A
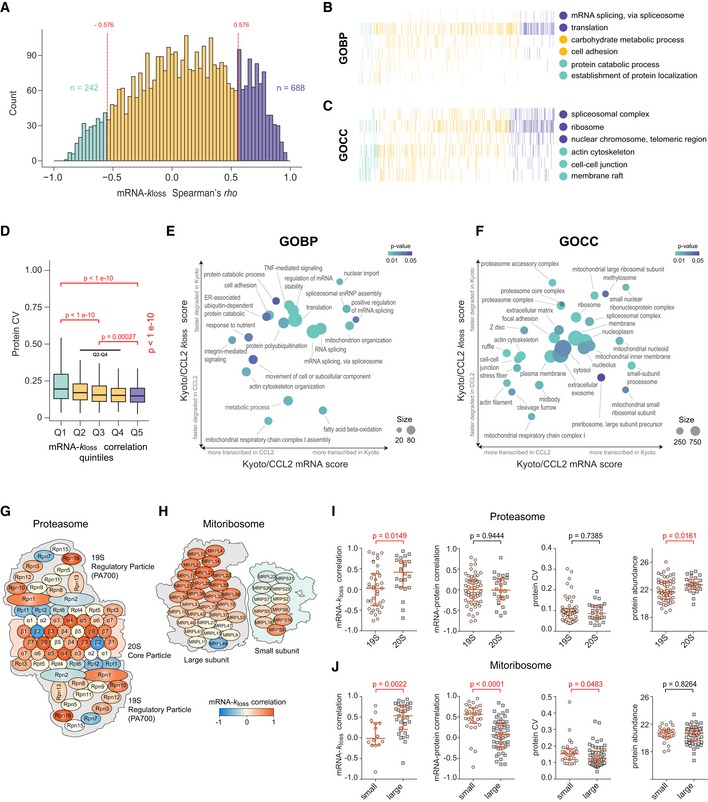
Distribution of isoform‐resolved protein‐specific mRNA–k
loss Spearman's rho (median ρ = 0.13) across the proteome. The colors highlight significant correlation values (P < 0.05). Spearman's rho was calculated for every protein AS group in the data set using twelve data points. All rho values were then summarized as histograms.
-
B, C
Selected biological processes (B, GOBP) and cellular compartments (C, GOCC) showing different distribution of mRNA–k
loss correlation.
-
D
The quantitative CVs of all protein AS groups across HeLa cell lines are distributed in five mRNA–k
loss correlation segments (Q1–Q5, each represents 20% of the data, include protein AS groups with the lowest and the greatest correlation, respectively; Kruskal–Wallis test P‐value is shown, pairwise comparisons were performed using pairwise Wilcoxon test with Benjamini–Hochberg correction). Box borders represent the 25th and 75th percentiles, bar within the box represents the median, and whiskers represent the minimum and maximum value within 1.5 times of interquartile range.
-
E, F
Two‐dimensional (2D) enrichment plot of selected GOBPs or GOCCs. The axes denote enrichment score for mRNA expression (x) and protein degradation (y) log2 FC HeLa Kyoto/CCL2.
-
G, H
Schematic representation of human proteasome (G, “KEGG: Proteasome”) and mitochondrial ribosome (H, GOCC DIRECT); colors correspond to mRNA–k
loss correlation (rho).
-
I, J
Statistical analysis of the differences between the proteasome (I) and mitoribosome (J) subunits (indicated by Wilcoxon test P‐values). The red lines denote median with interquartile range. The number of protein AS isoform groups is indicated by the number of dots.

