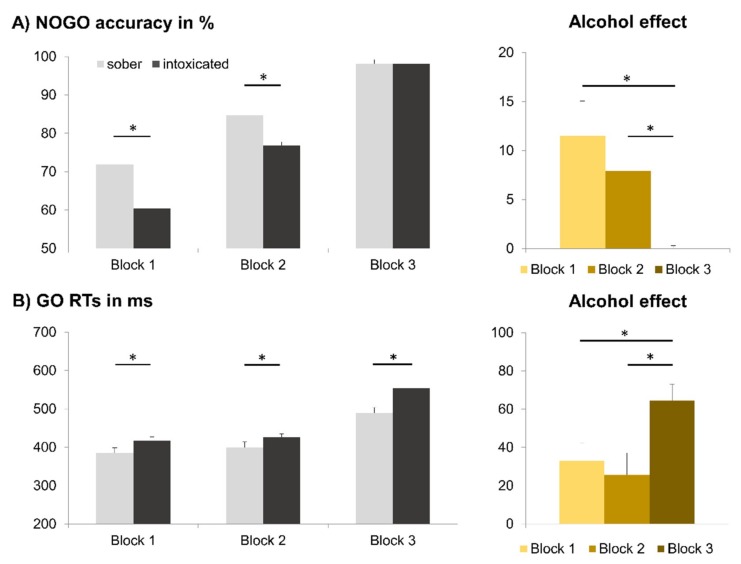
Figure 4.
Behavioral data. (A) On the left, accuracy (mean percentage of correct responses) in NOGO trials is shown for the different automatization blocks (left), while the alcohol effect (i.e., sober minus intoxicated) is shown on the right. (B) On the left, GO trial reaction time (RT) data (mean reaction times) are shown for the different automatization blocks, while the alcohol effect (i.e., intoxicated minus sober) is shown on the right. Significant results (p ≤ 0.05) are denoted with an asterisk. Error bars show the SEM as a measure of variability.

