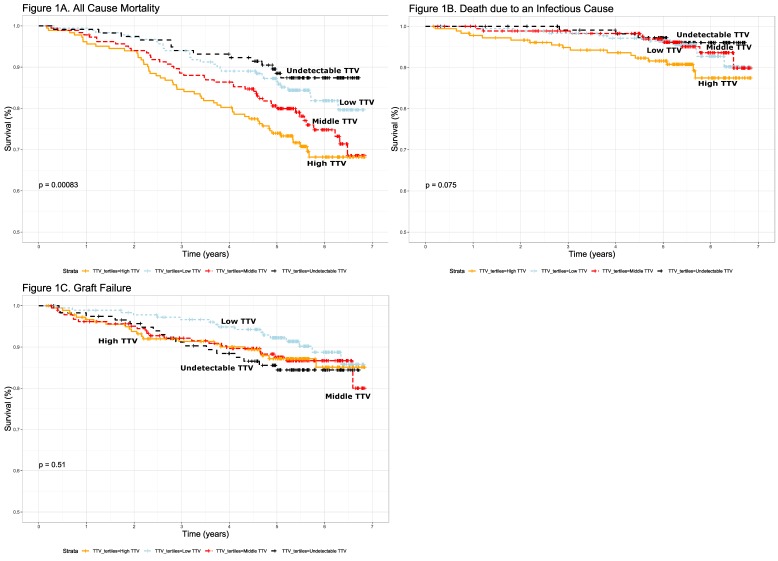
Figure 1.
Kaplan–Meier plots showing differences in survival (A,B), and graft failure (C) over time between undetectable low torquetenovirus TTV (black), low TTV (light blue), medium TTV (red) and high TTV (orange), as measured in a serum sample tested at least 12 months after transplantation. Time from testing is displayed (A) All-cause mortality (p < 0.001, (B) Death due to infectious causes (p = 0.08), (C)) graft survival (p = 0.51).

