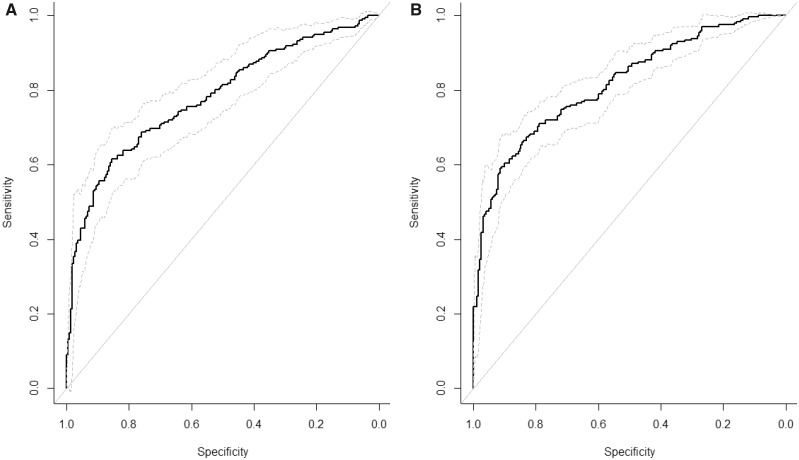
Figure 1.
Adjusted receiver operating characteristic curves for metabolites independently associated with liver cancer or liver disease mortality. A) Results for liver cancer (aAUC = 0.78, 95% CI = 0.74 to 0.83) including glycocholic acid, leu-val, hypoxanthine, and lysoPC(18:2). B) Results for liver disease mortality (aAUC = 0.82, 95% CI = 0.78 to 0.85) including glycochenodeoxycholic acid, lysoPC(18:2), serotonin, and trigonelline. aAUC = adjusted area under the curve; CI = confidence interval. The solid line represents the aAUC and the dashed lines represent the upper and lower 95% confidence intervals.

