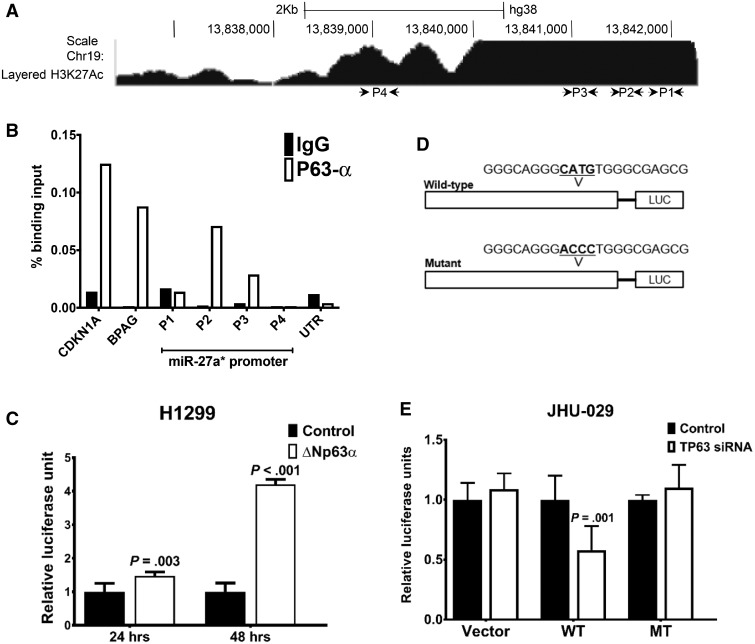
Figure 3.
Transcriptional regulation of microRNA (miR)-27a* expression. (A) Schematic representation of the miR-27a* promoter with putative TP53 and TP63 binding sites (P1-P4) along with chromatin immunoprecipitation-RNA sequencing (ChIP-seq) enrichment of H3K27ac from ENCODE. B) Binding of endogenous TP63α in UM-SCC-22A (22A) cells to the miR-27a* promoter element was analyzed by quantitative ChIP. Representative experiment was performed in triplicate and carried out three times independently. C) Results of luciferase assays in H1299 cells with the miR-27a* promoter luciferase (miR-27a*-luc) in the presence of vector control (control) or ΔNp63α cDNA. D) Schematic of wild-type (WT) and mutant (MT) miR-27a*-luc constructs with indicated alterations in the TP63 binding site. E) Results of luciferase assays, carried out using the WT and MT miR-27a*-LUC constructs in JHU-029 cells with control or TP63 small interfering RNA (siRNA). Empty luciferase vector (vector) was transfected along with control or TP63 siRNA in JHU-029 cells as a control, and data were normalized to Renilla luciferase. Luciferase experiments represent the average of two independent experiments with error bars representing mean (SD). P value was calculated using a two-sided Student t test.

