Figure 5.
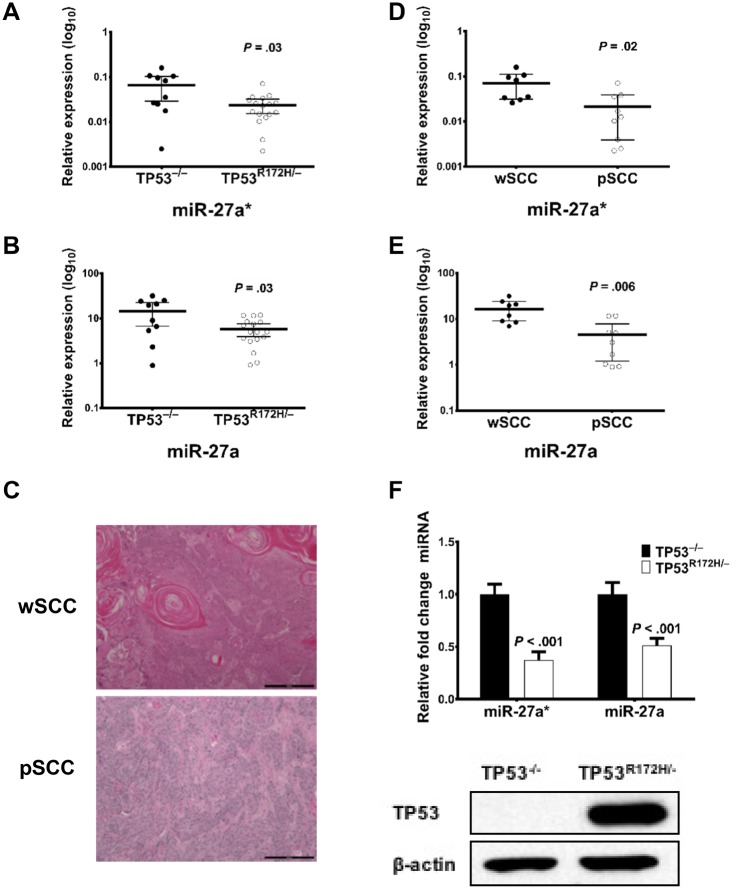
TP53R172H/– activation in murine skin. Quantitative polymerase chain reaction (qPCR) analysis of (A) microRNA (miR)-27a* and (B) miR-27a levels in RNA extracted from tumors obtained from TP53–/– and TP53R172H/– mice. Error bars represent mean 95% confidence intervals. C) Hematoxylin and eosin stain of tumor sections showing a gross appearance of well-differentiated squamous cell carcinoma (wSCC) and poorly differentiated SCC (pSCC) (scale bars = 200 µm). Analysis of (D) miR-27a* and (E) miR-27a levels in wSCC tumors and pSCC tumors. Error bars represent 95% confidence intervals of the mean. P value determined using a two-sided Student t test. (F) Expression levels of TP53 protein and mRNA in cells generated from SCC obtained from TP53 –/– and TP53R172H/– mice. qPCR data were normalized to Sno234. Error bars represent mean (SEM).

