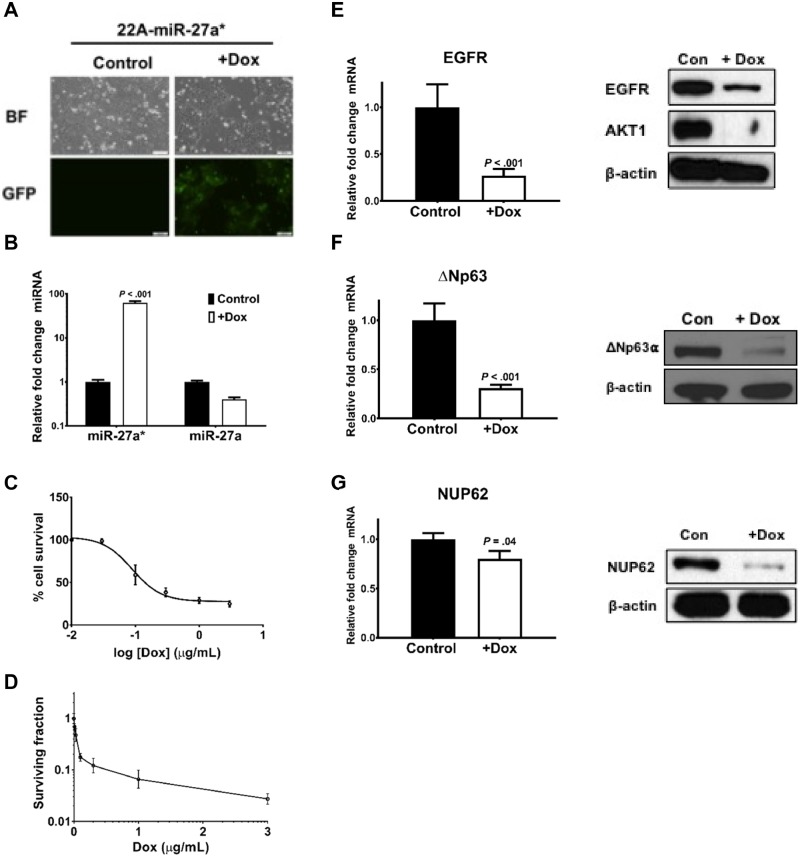
Figure 6.
ΔNp63α expression levels following microRNA (miR)-27a* induction. (A) Green fluorescent protein (GFP) expression in the 22A-miR-27a* cells is induced only on the addition of doxycycline (Dox) (BF: brightfield) (scale bars = 100 µm). (B) Expression of miR-27a* and miR-27a following treatment with Dox as measured by quantitative polymerase chain reaction (qPCR). Cell viability assessed using the (C) MTT assay and (D) clonogenic assay following miR-27a* induction. Error bars represent mean (SD). Quantification of mRNA and protein levels of (E) epidermal growth factor receptor (EGFR), (F) ΔNp63, and (G) NUP62 as measured by qPCR and immunoblotting, respectively, on induction of miR-27a* in 22A-miR-27a* cells. Error bars represent mean (SEM). TATA-box binding protein (TBP) was used as endogenous control in qPCR. All statistical tests were two-sided.

