Figure 7.
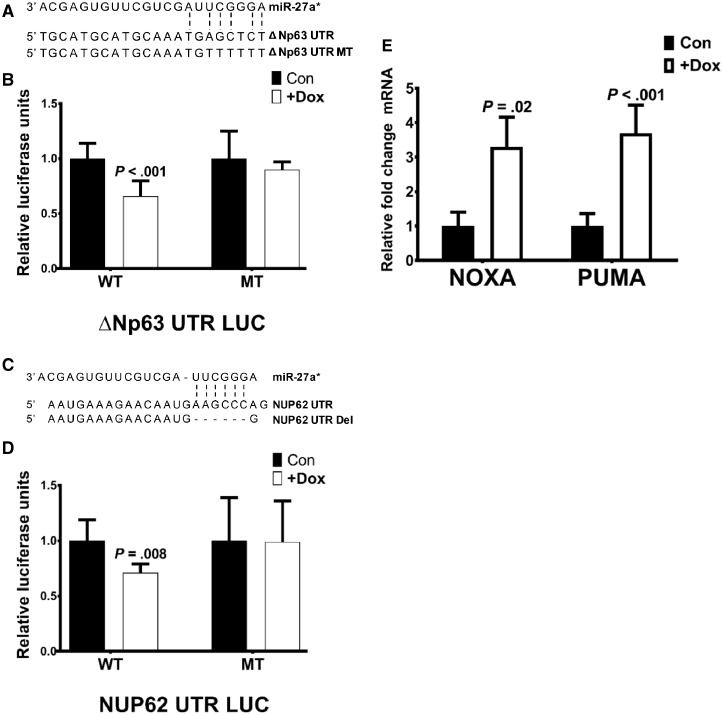
Interaction of microRNA (miR)-27a* with the ΔNp63α network. Schematic representation of the miR-27a* binding sites on the 3’UTR of (A) ΔNp63 and (C) NUP62 with the mutations (MT) or deletions (Del) generated in the respective miR-27a* binding site sequences. Luciferase assays with the (B) ΔNp63α and (D) NUP62 wild-type (WT) and MT UTR LUC constructs in 22A-miR-27a* cells. Renilla was used as a normalization control. Data represent the average of two independent experiments carried out in triplicate. Error bars represent mean (SD). E) Expression levels of ΔNp63α target genes NOXA and PUMA on induction of miR-27a* in 22A-miR-27a* cells were analyzed by quantitative polymerase chain reaction. Error bars represent mean (SEM). TATA-box binding protein (TBP) was used as endogenous control in qPCR. P value calculated using two-sided tests.

