Figure 5.
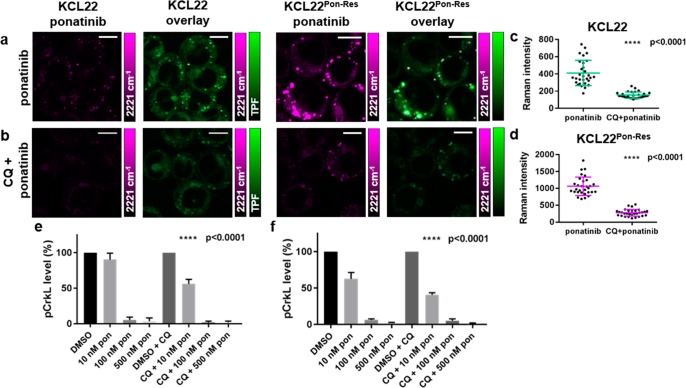
Multimodal imaging and quantitative assessment of the effect of chloroquine treatment on the vesicular uptake of ponatinib. KCL22 and KCL22Pon-Res cells were treated with (a) ponatinib (5 μM, 1 h), (b) chloroquine (20 μM, 2 h) followed by combination treatment of ponatinib (5 μM, 1 h) and chloroquine (20 μM, 1 h). Images shown (left to right) 2221 cm–1 (C≡C, ponatinib), overlay TPF image at 861 nm (Lysotracker Green) merged with 2221 cm–1. (c,d) Mean ponatinib Raman intensity inside the vesicles of each individual cell quantified in (c) KCL22 and (d) KCL22Pon-Res cell line, n = 10 cells, three biological repeats. Images acquired at 1024 × 1024 pixels, 20 μs pixel dwell time with false colors applied to different detection wavenumbers. Scale bars: 10 μm. (e,f) p-CRKL level quantification from Western blots where KCL22 and KCL22Pon-Res cells were treated with (left to right) either DMSO (0.0003%, v/v), ponatinib (10, 100, 500 nM, 1 h), or a combination of chloroquine (20 μM, 2 h) pretreatment and ponatinib (10, 100, or 500 nM, 1 h). p-CRKL level was quantified against α-tubulin control and normalized to DMSO using Image Lab Software. One-Way ANOVA (Tukey’s multiple comparisons test) was used to compare ponatinib (10 nM) alone vs CQ combination treatment.

