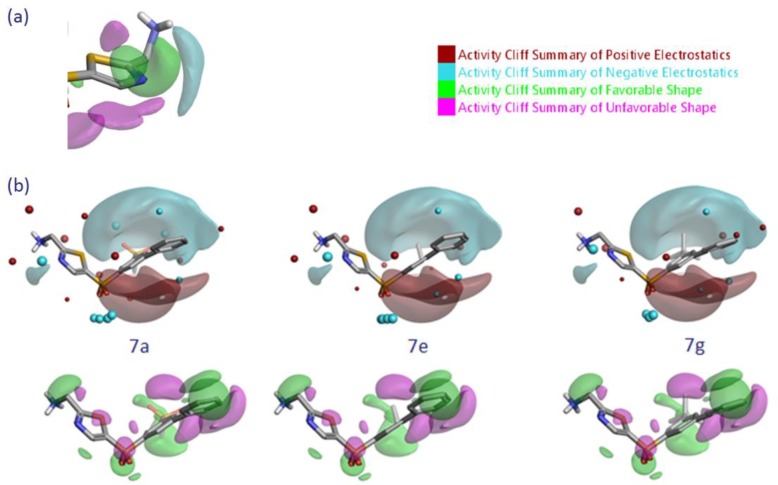
Figure 7.
Activity Atlas/activity cliff summary plots for LOXL2 activity shown with (a) 7a around thiophene/thiazole core, (b) 7a, 7e, and 7g to illustrate steric and electrostatic contributions (using field points, as described above) that rationalize the observed SAR. All isosurfaces are shown at ≥2.0 confidence level.

