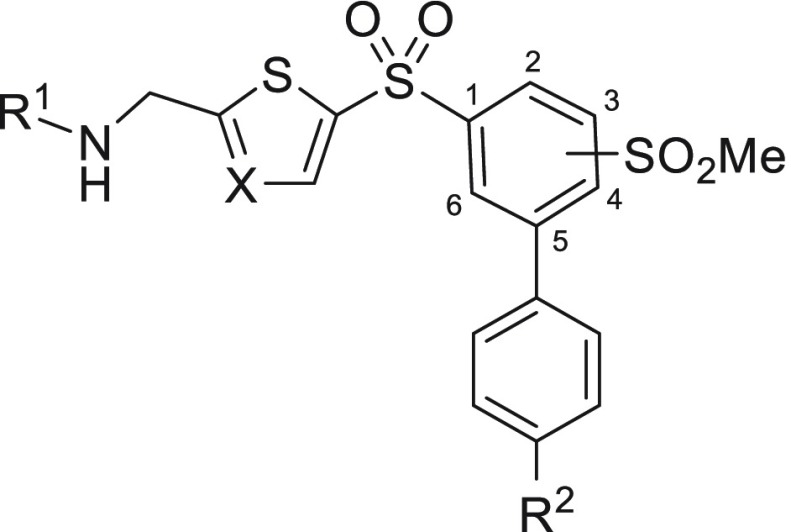
Table 2. Effects of Thiophene vs Thiazole Cores on LOXL2 Potency.
| entry | compd | X | R1 | R2 | SO2Me position | LOXL2, IC50 (μM)a |
|---|---|---|---|---|---|---|
| 1 | 3a | CH | H | H | 3 | 0.176 |
| [0.105, 0.295] | ||||||
| 2 | 3b | CCl | H | H | 3 | 2.488 |
| 2.164 | ||||||
| 3 | 3c | CF | H | H | 3 | 0.671 |
| 0.714 | ||||||
| 4 | 7a | N | H | H | 3 | 0.086 |
| [0.061, 0.119] | ||||||
| 5 | 7b | N | CH3 | H | 3 | 68.26 |
| [43.77, 106.5] | ||||||
| 6 | 8 | CH | H | CH3 | 4 | 0.686 |
| [0.456, 1.031] | ||||||
| 7 | 9 | N | H | CH3 | 4 | 0.423 |
| [0.302, 0.593] |
Reported IC50 values were determined using 1 h preincubation in at least two separate experiments (n ≥ 2). When n = 2, individual IC50 values are shown. When n > 2, the values are reported as the geometric mean with the corresponding 95% confidence interval in square brackets.

