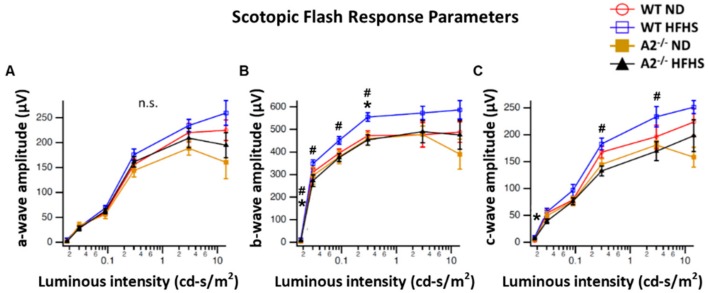
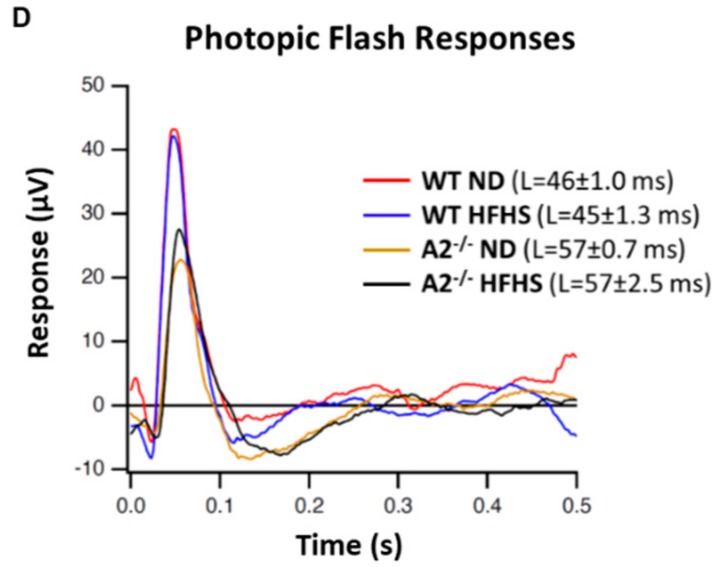
Figure 6.
Electroretinogram (ERG) responses were recorded after overnight dark adaptation from mice in scotopic conditions and amplitudes were analyzed as a function of light intensity (n = 5 per group). Scotopic flash responses are provided for the a-, b-, and c-wave ERG components (A–C, respectively). Mean amplitudes with standard errors are plotted against luminance for each group. Averaged photopic responses (D) evoked by brief (5 ms) flashes are shown for each group. * p < 0.05 for the difference between the WT HFHS and WT ND groups, # p < 0.05 for the difference between the WT HFHS and A2−/− HFHS groups.


