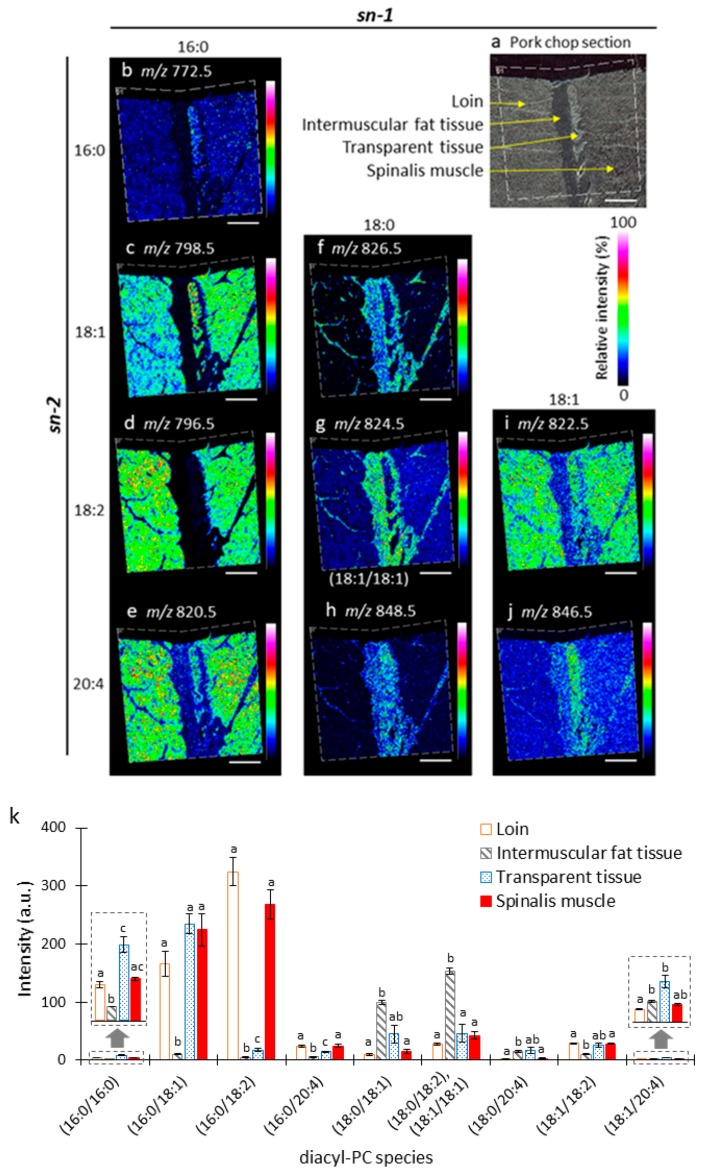
Figure 4.
MALDI–MSI analysis of diacyl-phosphatidylcholine (PC) species in pork chop sections. (a) Optical image of pork chop section prior to MALDI–MSI analysis. (b–j) Representative ion images arranged according to their fatty acid compositions. Fatty acid compositions at the sn-1 position are arranged along the x-axis, and those at the sn-2 position are arranged along the y-axis. Scale bar represents 2 mm. (k) Intensities of diacyl-PC species in longissimus thoracis et lumborum muscle (loin), intermuscular fat tissue, transparent tissue, and spinalis muscle using MALDI-MSI. The data are expressed as the mean ± standard deviation (n = 3). Mean values with different letters indicate significant differences (p < 0.05) as determined by Dunnett’s T3 multiple comparisons test.

