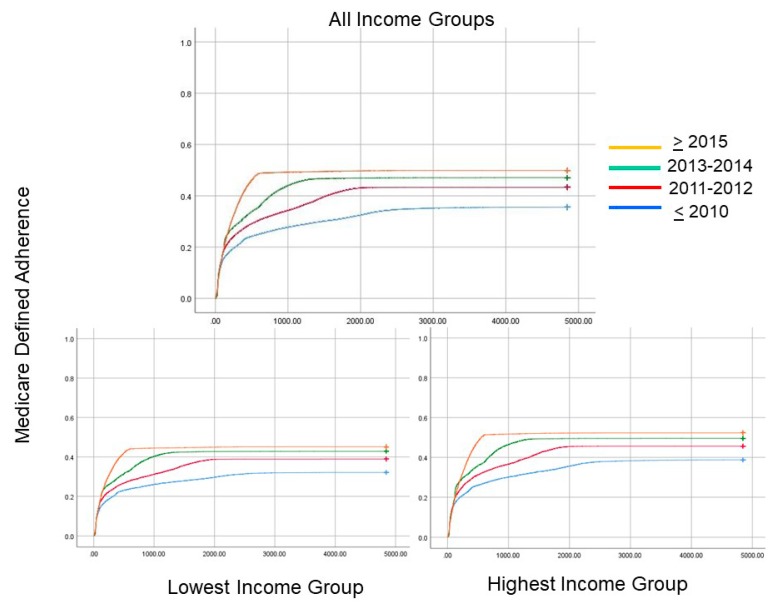
Figure 5.
(a) The upper panel shows Kaplan–Meir curves that reveal differences in the temporal pattern of adherence to positive airway pressure (PAP) therapy (by Medicare-defined criteria) based upon the year of set-up or PAP initiation. Note that progressively after 2010 there is a greater proportion of individuals who are adherent by Medicare standards and they accomplish such adherence earlier in time after their device is set-up (Log Rank; p < 0.0001). The lower panels reveal similar graphs for the (b) lowest and (c) highest income groups.

