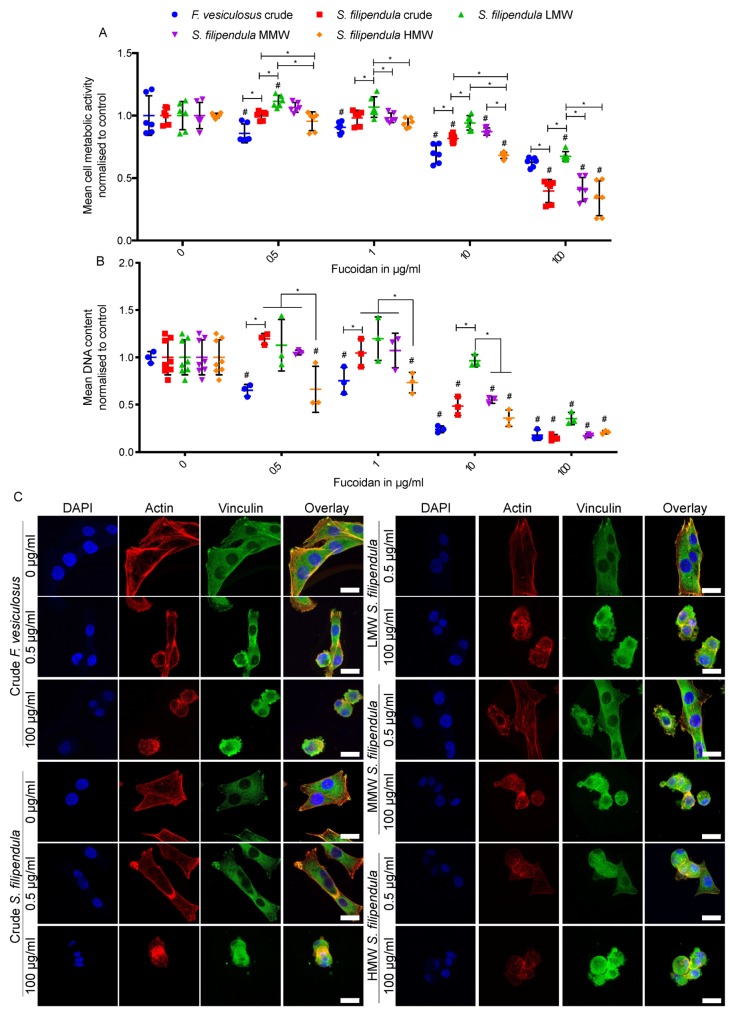
Figure 1.
Effect of different fucoidans on MG63 cell attachment. Mean ± SD of (A) metabolic activity and (B) DNA content after 24 h of seeding in the presence of fucoidan (n = 6). (C) Max intensity z-projections for DAPI (blue)-, Actin (Texas Red)- and Vinculin (FITC)-stained cells with overlays, after 24 h of seeding in presence of fucoidan. Scale bars, 25 µm. * p < 0.05, # p < 0.05 relative to respective vehicle controls.

