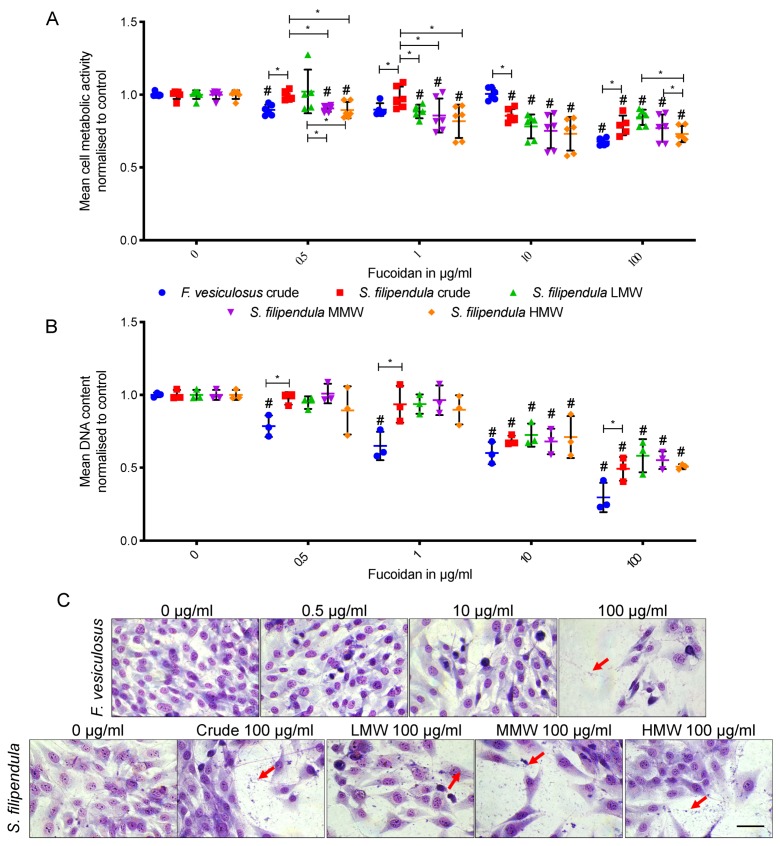
Figure 2.
Mean ± SD of (A) cell metabolic activity (n = 6) and (B) DNA content (n = 3) of MG63 cells after 3 days treatment with different fucoidans, where fucoidans were applied on day 1. (C) Giemsa-stained MG63 cells after 3 days treatment with different fucoidans. Scale bar—50 μm. * p < 0.05, # p < 0.05 relative to respective vehicle controls. Red arrows—cell debris.

