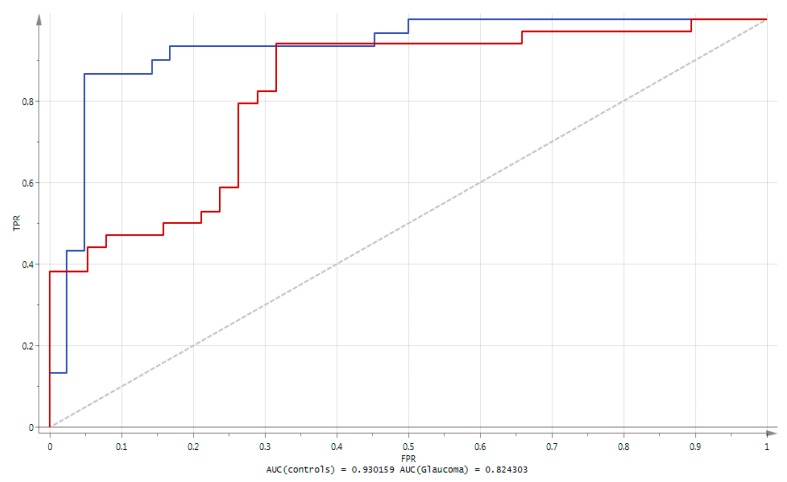
Figure 2.
Results of the Receiver Operating Characteristic (ROC) curve analysis using the 8 metabolites derived from the multivariate OPLS-DA model. The blue line represents the Area Under the ROC Curve (AUC) obtained for controls, whilst the red line represents the AUC obtained for glaucoma patients. The ROC plots represent the sensitivity (i.e., True Positive Rate TPR) versus 1—the specificity (i.e., False Positive Rate FPR).

