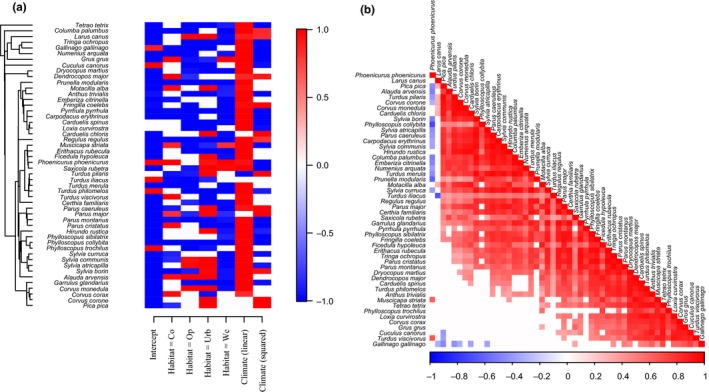
Figure 1.

Exploring parameter estimates. Panel (a) shows those β parameters (species responses to environmental covariates) with at least 95% posterior probability of being positive (red) or negative (blue) in model PA.X. The species are ordered according to their phylogeny shown on left. Panel (b) illustrates the residual association structure in model PA.S, with positive associations with high (at least 95% posterior probability) statistical support shown in red and negative associations in blue. The species have been ordered in a way that best illustrates the association structure of the data
