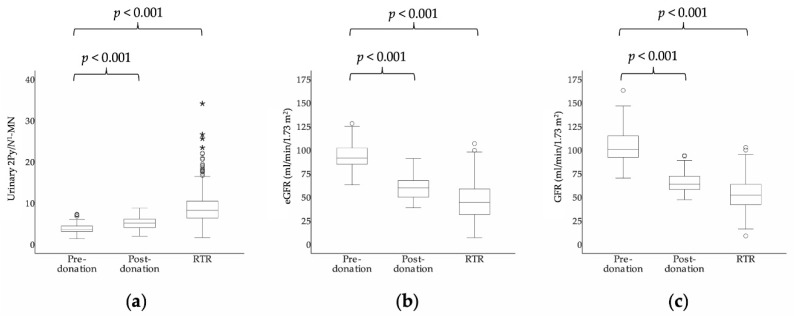
Figure 2.
Box plots of (a) urinary 2Py/N1-MN, (b) eGFR and (c) GFR in kidney donors before (n = 85) and after kidney donation (n = 85) and RTR (n = 660), respectively. Boxes, bars and whiskers represent IQRs, medians and values <1.5 × IQR, respectively, whereas outliers (1.5–3 × IQR) are indicated by circles and extreme outliers (>3 × IQR) by asterisks. p-value for difference between kidney donors before and after kidney donation was tested by paired samples t and Wilcoxon signed rank tests for normally and skewed distributed continuous variables, respectively. p-value for difference between RTR and kidney donors before donation was tested by t and Mann–Whitney tests for normally and skewed distributed continuous variables, respectively. eGFR, estimated glomerular filtration rate; GFR, glomerular filtration rate; N1-MN, N1-methylnicotinamide; RTR, renal transplant recipients; 2Py, N1-methyl-2-pyridone-5-carboxamide; 2Py/N1-MN, ratio of 2Py to N1-MN.

