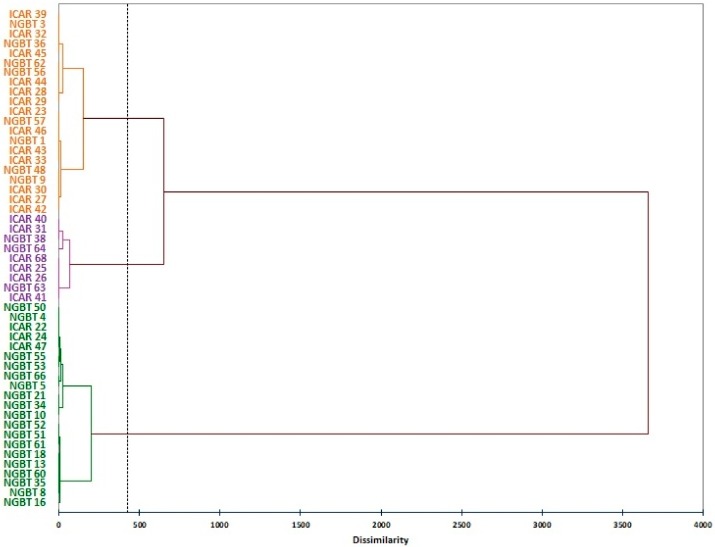
Figure 2.
Dendrogram based on dissimilarity matrix calculated from morphometric seed traits in the faba bean collection split in samples collected by the National Gene Bank of Tunisia (NGBT) and Agricultural Research in the Dry Areas (ICAR). The colors orange, purple, and green were used to distinguish between the medium, large, and small seed type clusters, respectively.

