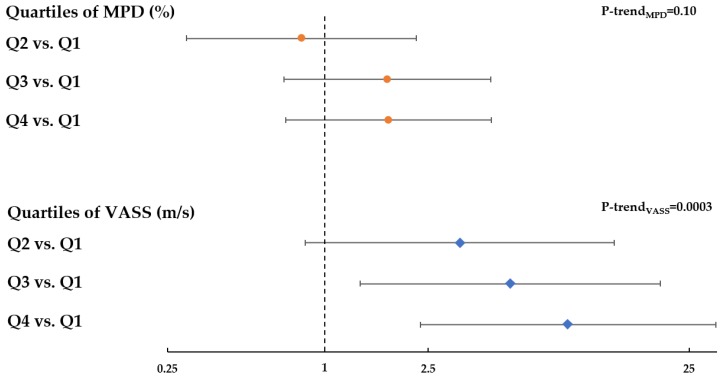
Figure 3.
Adjusted odds ratios (ORs) and 95% confidence intervals (CIs) for the relation of quartiles of MPD (orange circle) and UST volume-averaged sound speed (blue diamond) with breast cancer risk. Quartiles were defined based upon distribution among controls. OR and 95% CI were estimated from logistic regression model adjusted for age, race, and menopausal status.

