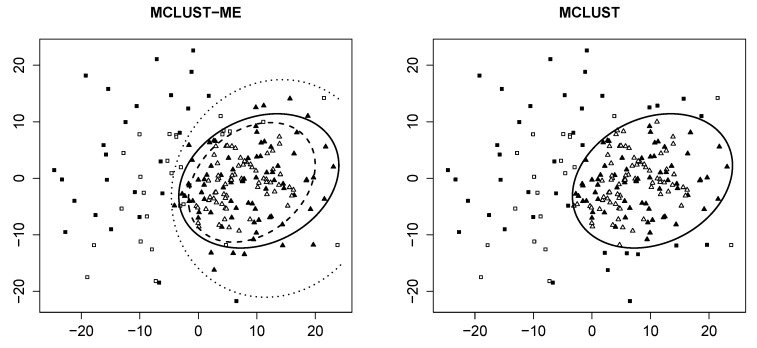
Figure 1.
Clustering result of the sample generated with random seed and . Both plots: empty points represent observations with no measurement errors; solid points represent those generated with error covariance . Clusters are identified by different shapes. Left: clustering result produced by MCLUST-ME. Dashed line represents classification boundary for error-free observations; dotted line represents boundary for those with error covariance matrix ; solid line represents boundary produced by MCLUST. Right: clustering result produced by MCLUST. Solid line is the same as in the left plot.

