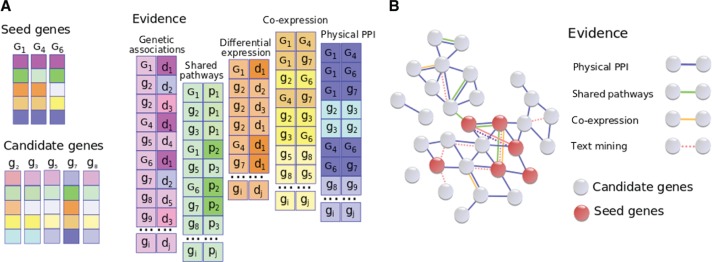
Figure 2:
Data representation models utilized by gene prioritization tools. A. Relational data structure. The first and the third evidence sources provide relationships between genes labeled with G (seeds) or g (candidates) and diseases (d), the second source provides gene membership in pathways (p) and the last two evidence sources contain different kinds of interactions between genes. Vector representation of seed and candidate genes are shown on the left. The similarity between colorings of gene g7 and seed genes shows that g7 seems to be a promising candidate. B. Network data structure. Nodes depict genes, edges show relationships between genes. Seed genes are highlighted with red. Types of interactions and associations are shown on the right.

