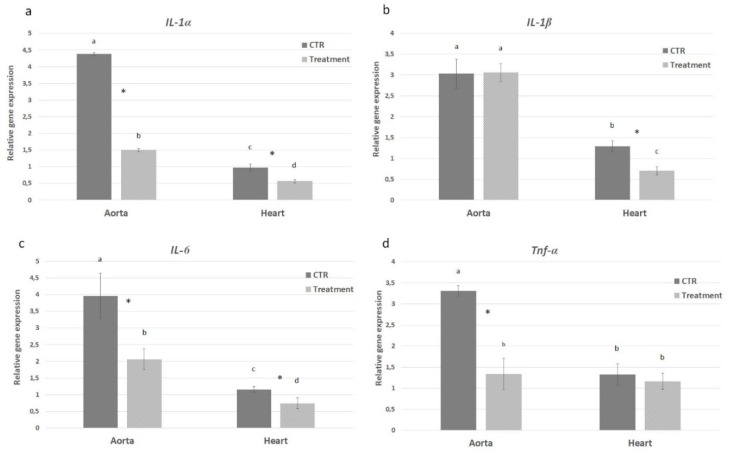
Figure 7.
Effect of anchovy protein hydrolysates on proinflammatory cytokines. Quantitative gene expression of IL-1α (a), IL-1β (b), IL-6 (c), and Tnf-α (d). Bars represent the mean ± SD (n = 6). Asterisks denote statistically significant differences with respect to control. Different letters indicate significant differences among groups (* p < 0.05).

