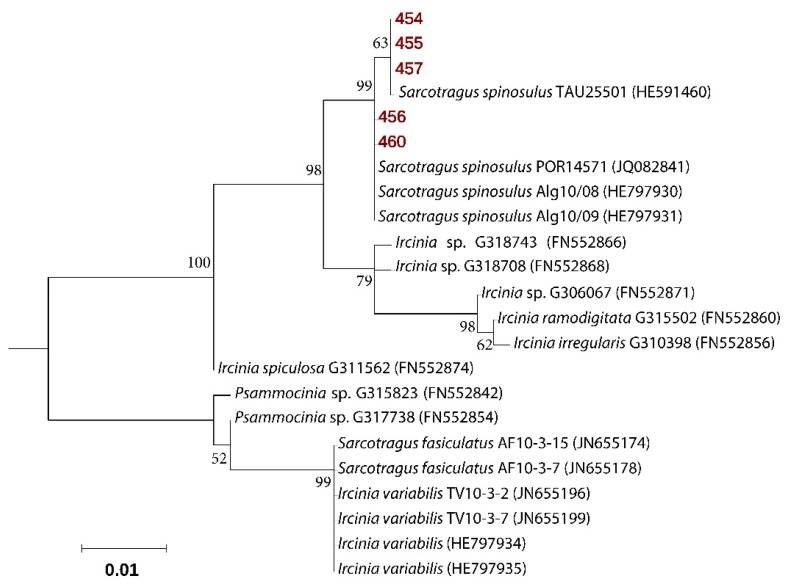
Figure 1.
Molecular phylogenetic analysis based on cytochrome oxidase gene, subunit 1 sequences. The Maximum Likelihood tree is shown, with sequences repossess in this study highlighted in bold and red. Bootstrap values derive from 1000 replications and are shown at branch nodes. Values above 50% are shown.

