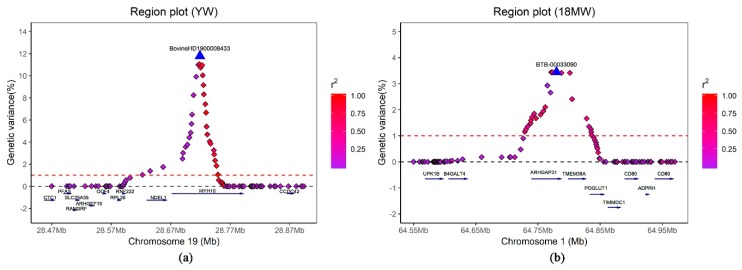
Figure 2.
Region plots of the two major candidate regions on BTA19 and BTA1. Results were shown for YW around 28.47–28.90 Mb on BTA19 (a) and for 18MW at 64.55–64.98 Mb on BTA1 (b). The primary SNP within each region is denoted by a large blue triangle. Different levels of linkage disequilibrium between the primary SNP and surrounding SNPs were represented by colored rhombi.

