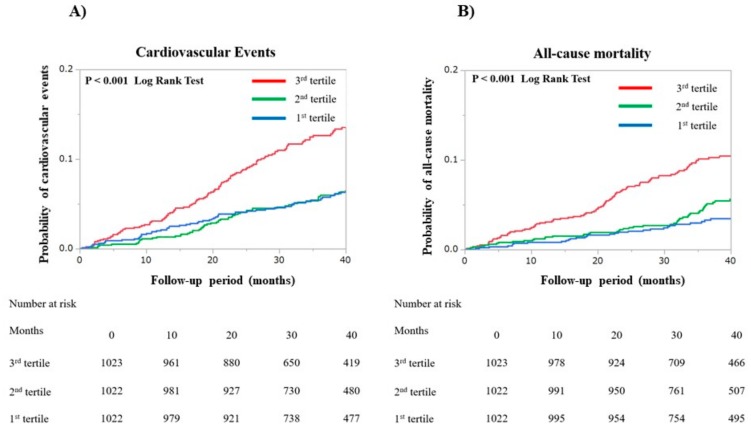
Figure 3.
Kaplan—Meier curves were plotted to compare the incidences of both (A) cardiovascular events and (B) all-cause mortality events for the three patient groups that comprise the first, second, and third tertiles of the Fibrosis-4 index. Cardiovascular events included heart failure, myocardial infarction, unstable angina, and cardiac death.

