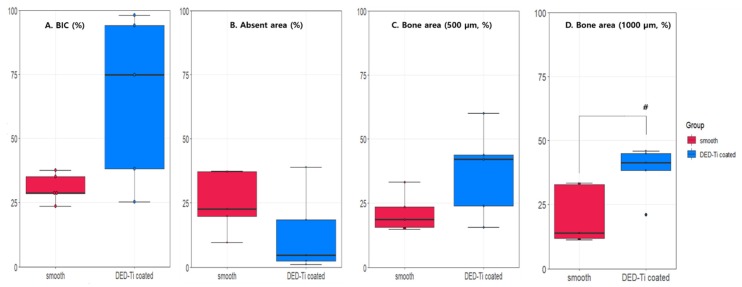
Figure 9.
The results of bone histomorphometry. In A: BIC (p = 0.095), B: absent area (p = 0.222), and C: 500 µm bone area (p = 0.095) there were no significant differences between the smooth and DED groups. D: However, in the 1000 µm bone area, the DED group exhibited a significantly higher new bone formation than the smooth group (p = 0.0317). (# p < 0.05).

