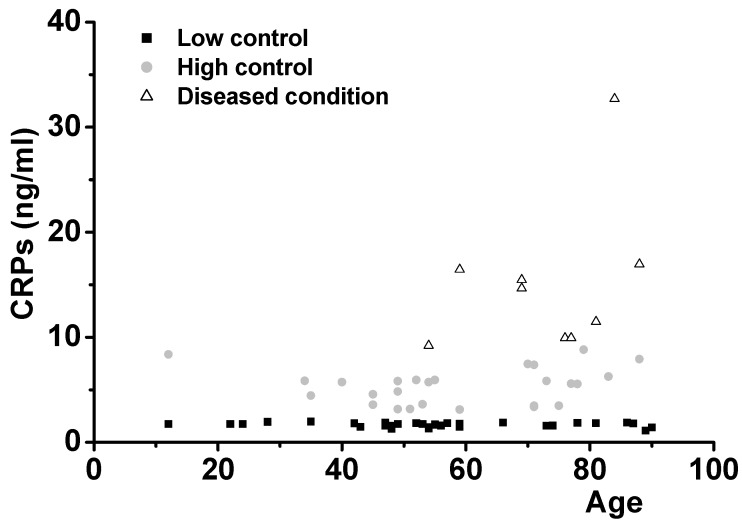
Figure 3.
C-reactive proteins (CRPs) levels of low controls, high controls, and diseased conditions were tested. Averages and SD were 1.67 ± 0.21 for the low-level control group (31 cases), 5.34 ± 1.70 for the high-level control group (26 cases), and 15.20 ± 7.21 for the 9 diseased cases. One-way ANOVA was carried out to test the significance of the data: p < 0.01 between low controls, high controls, and diseased conditions and p < 0.01 between high controls and diseased conditions.

