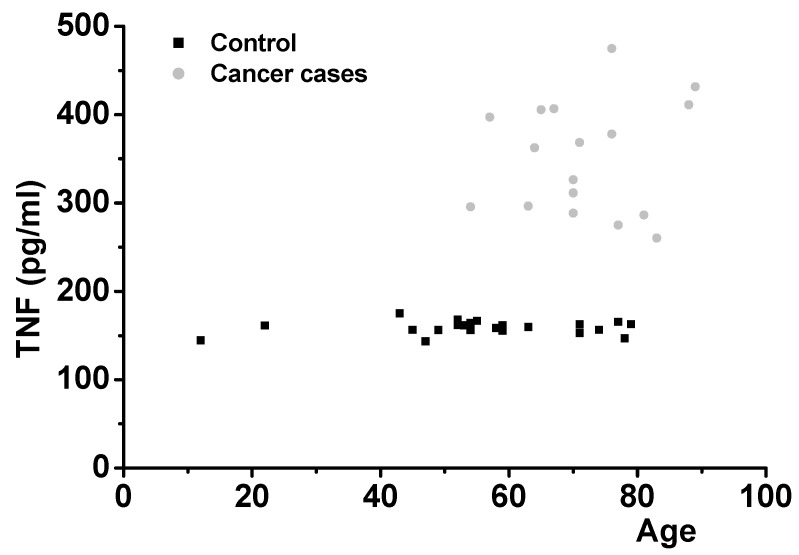
Figure 4.
TNF levels in controls and cancer cases were tested. Averages and SD were 159.18 ± 7.38 for controls (25 cases) and 351.53 ± 63.8 for cancer cases (17 cases). The values ranged from 260 pg/mL to 474 pg/mL. There was no overlap between normal and cancer cases. One-way ANOVA was carried out to test the significance of the data: p < 0.01 between controls and cancer cases.

