Figure 1.
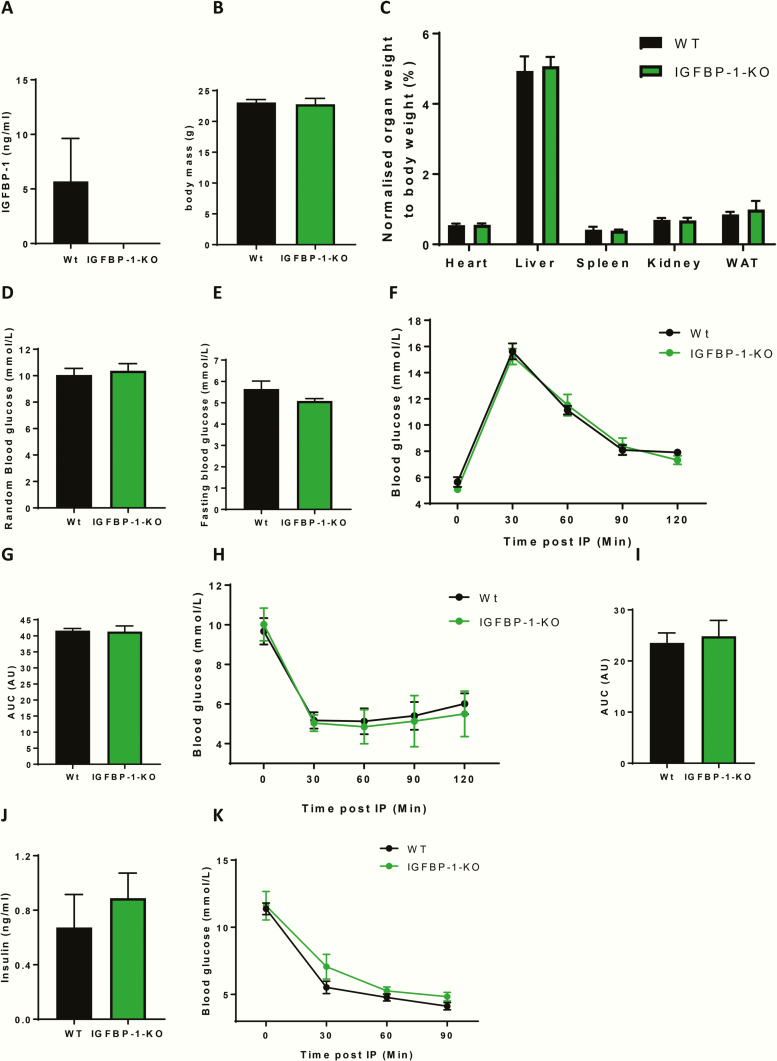
Metabolic profiling of IGFBP-1-KO mice. (A) Plasma was taken from IGFBP- 1-KO mice and wildtype litter mate controls, ELISA data confirmed IGFBP-1 knockdown (IGFBP-1-KO 0 ± 0 v Wt 5.69 ± 3.93 ng/mL). (B) Body mass was no different between groups (IGFBP-1-KO 22.8 ± 0.9 v Wt 23.1 g ± 0.9). (C) There was no difference in organ weights of IGFBP-1-KO mice when compared with wild-type litter mate control mice when normalized to body weight (Heart Wt 0.55 ± 0.04 v IGFBP-1-KO 0.56 ± 0.04) (Liver Wt 4.9 ± 0.4 v IGFBP-1-KO 5.07 ± 0.04) (Spleen Wt 0.4 ± 0.08 v IGFBP-1-KO 0.39 ± 0.03) (Kidney Wt 0.68 ± 0.05 v IGFBP-1-KO 0.6 ± 0.07) (WAT Wt 0.85 ± 0.07 v IGFBP-1-KO 0.9 ± 0.2). (D) Random blood glucose was no different between groups (IGFBP-1-KO 10.4 ± 0.5 v Wt 10 ± 0.5). (E) Fasting blood glucose was no different between groups (IGFBP-1-KO 5.1 ± 0.1 v Wt 5.6 ± 0.4). (F) Change in blood glucose levels after an IP injection of glucose, showed no difference in glucose handling, also shown by area under the curve analysis in G (IGFBP-1-KO 41.3 ± 1.8 v Wt 41.6 AU ± 0.7). (H) Change in blood glucose levels after an IP injection of insulin, showed no difference in insulin sensitivity, also shown in area under the curve analysis in I: (IGFBP-1-KO 24.8 ± 3.1 v Wt 23.5 AU ± 1.9). (J) Random plasma insulin was no different between groups (IGFBP-1-KO 0.89 ± 0.18 v Wt 0.67 ± 0.24). (K) Change in blood glucose levels after an IP injection of IGF-I shows that IGFBP-1-KO mice was not significantly different between the groups. Data are presented as mean ± SEM. N = 6 to 8 per group unless otherwise stated. (*P ≤ 0.05).

