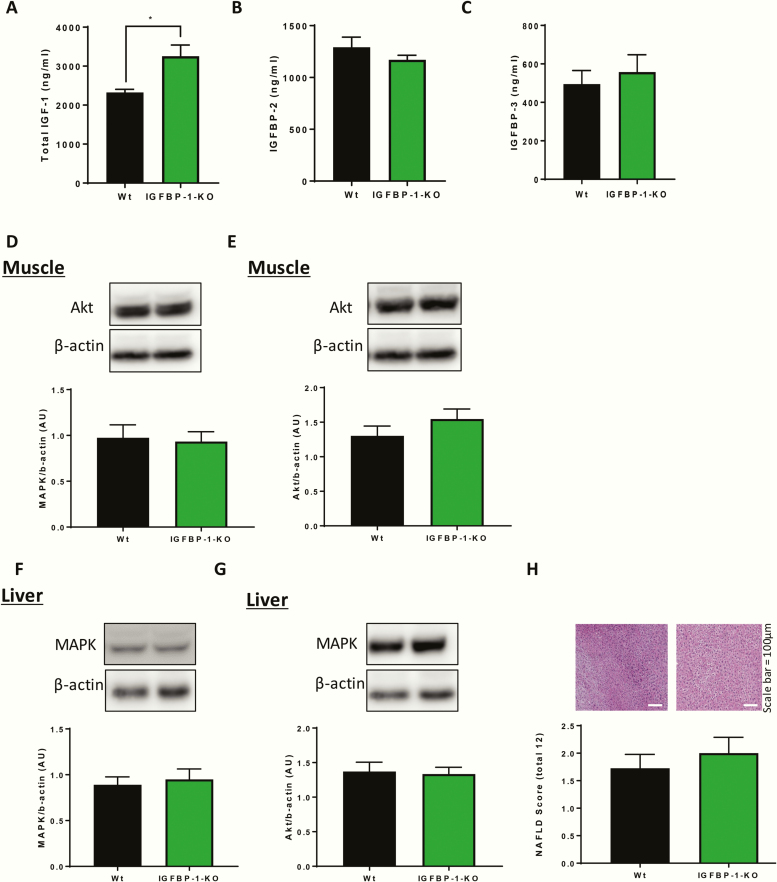
Figure 2.
Plasma levels and signaling nodes in IGFBP-1 knockdown mice. (A) Plasma was taken from IGFBP-1-KO mice and wild-type litter mate controls and there was an increase in circulating total IGF-I levels (IGFBP-1-KO 3257 ± 285.8 V Wt 2327 ± 77.61 ng/mL). N = 5 to 7 per group for plasma samples. (B) Plasma was taken from IGFBP-1-KO mice and wildtype litter mate controls and there was no difference in circulating IGFBP-2 levels (IGFBP-1-KO 1171 ± 44.09 V Wt 1292 ± 97.36 ng/mL) C: Plasma was taken from IGFBP-1-KO mice and wild-type litter mate controls and there was no difference in circulating IGFBP-3 levels (IGFBP-1-KO 557.8 ± 90.03 V Wt 495.3 ± 70.1). (D,E) There was no difference in AKT or MAPK expression in the muscle of IGFBP-1-KO mice when compared with their wild-type litter mate controls. (F,G) There was no difference in AKT or MAPK expression in the liver of IGFBP-1-KO mice when compared to their wildtype litter mate controls. N = 5 per group for blotting studies. (H) Histological examination of liver showed there was no difference in non-alcoholic fatty liver disease (NAFLD) score (Wt 1.8 ± 0.2 V IGFBP-1-KO 2 ± 0.3) (n = 4). Data are presented as mean ±SEM. (*P ≤ .05).

