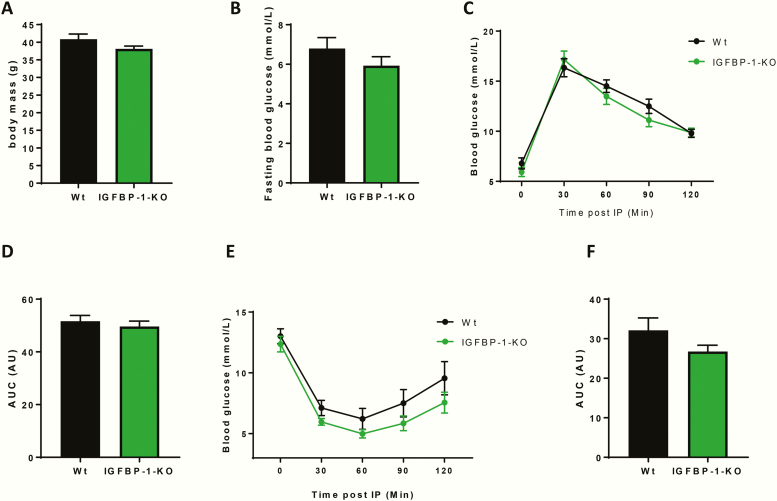
Figure 3.
Metabolic profiling of IGFBP-1-KO obese mice. (A) Body mass was no different between groups (IGFBP-1-KO 38.8 ± 0.8 v Wt 40.8g ± 1.5). (B) Fasting blood glucose was no different between groups (IGFBP-1-KO 5.9 ± 0.44 v Wt 6.8 ± 0.55). (C) Change in blood glucose levels after an IP injection of glucose, showed no difference in glucose handling, also shown by area under the curve analysis in D (IGFBP-1-KO 49.6 ± 2 v Wt 51.6AU ± 2.2). (E) Change in blood glucose levels after an IP injection of insulin showed no difference in insulin sensitivity, also shown in area under the curve analysis in F (IGFBP-1-KO 26.76 ± 1.6 v Wt 32.11AU ± 3.1). Data are presented as mean ± SEM. N = 6 to 8 per group. (*P ≤ .05).

