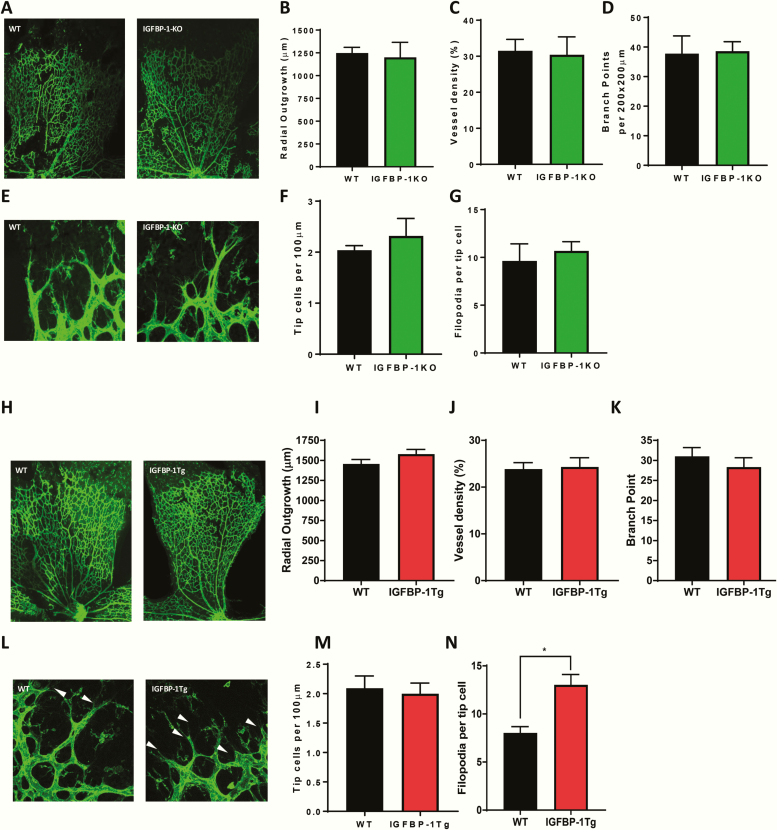
Figure 5.
IGFBP-1 expression and developmental angiogenesis. (A–G) Retinas from IGFBP-1-KO mice p5 and wild-type litter mate controls were used to investigate the effects of IGFBP-1 knockout on developmental retinal angiogenesis. (A) Representative whole mount images. (B) There was no difference in vascular outgrowth (IGFBP-1-KO 1201 ± 165.4 V Wt 1248 ± 62.55), (C) vessel density (IGFBP-1-KO 30.4 ± 5 V Wt 31.5 ± 3.2), or (D) branching complexity (IGFBP-1-KO 38.6 ± 3.2 V Wt 37.8 ± 6) between IGFBP-1-KO mice and wild-type litter mate controls. (E) Representative images of vascular front of retinas from IGFBP-1-KO mice and wild-type litter mate controls. (F) There is no difference between tip cell number (IGFBP-1-KO 2.3 ± 0.34 V Wt 2.1 ± 0.1) or (G) number of filopodia (IGFBP-1-KO 10.7 ± 0.95 V Wt 9.3 ± 1. 78) between IGFBP-1-KO mice and wild-type litter mate controls (N = 4–5 per group). (H–N) Retinas from hIGFBP-1 overexpressing mice and wildtype litter mate controls were used to investigate the effects of hIGFBP-1 overexpression on retinal angiogenesis. (H) Representative whole mount images. (I) There is no difference in vascular outgrowth between IGFBP-1-tg mice and wildtype litter mate controls (tg 1579 ± 58.4 V Wt 1456 ± 55.6). (J) There is no difference in vessel density between IGFBP-1-tg mice and wild-type litter mate controls (tg 24.3 ± 2 V Wt 23.9 ± 1.4). (K) There is no difference in branching complexity between IGFBP-1-tg mice and wild-type litter mate controls (tg 28.4 ± 2.3 V Wt 31 ± 2.2). (L) Representative vascular front images. (M) There is no difference between tip cell number between IGFBP-1-tg mice and wild-type litter mate controls (tg 2 ± 0.18 V Wt 2.1 ± 0.21). (N: There is an increase in number of filopodia (white arrow head) in IGFBP-1-tg mice when compared with wild-type litter mate controls (tg 13 ± 1.1 V Wt 8 ± 0.66). N = 5 to 7 per group. Data are presented as mean ± SEM.

