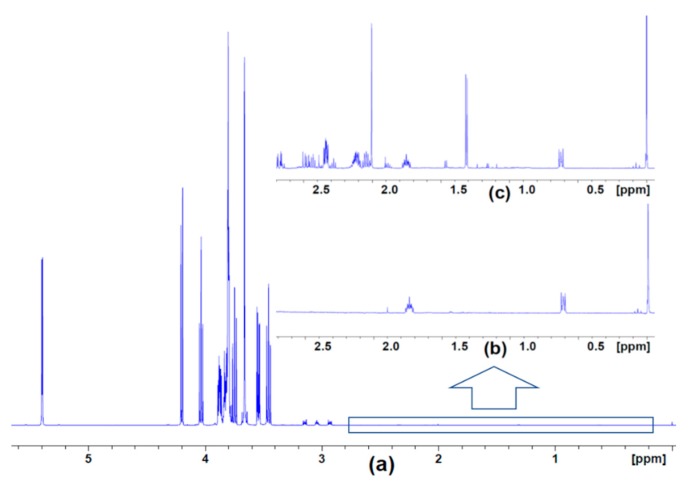
Figure 1.
1H nuclear magnetic resonance (NMR) spectra of the SYN-Per reagent alone and after its use in extracting metabolites from synaptosomes obtained from control animals. (a) Full spectrum of SYN-Per showing the predominant peaks between 3.5 and 4.3 ppm and at 5.4 ppm. (b) Expansion of the boxed region of (a), which exhibits smaller signals from DSS (sodium trimethylsilylpropanesulfonate) along with the major DSS peak at 0 ppm. (c) Same spectral region as in (b) following extraction of metabolites from control animals; the additional peaks are ascribed to extracted metabolites.

