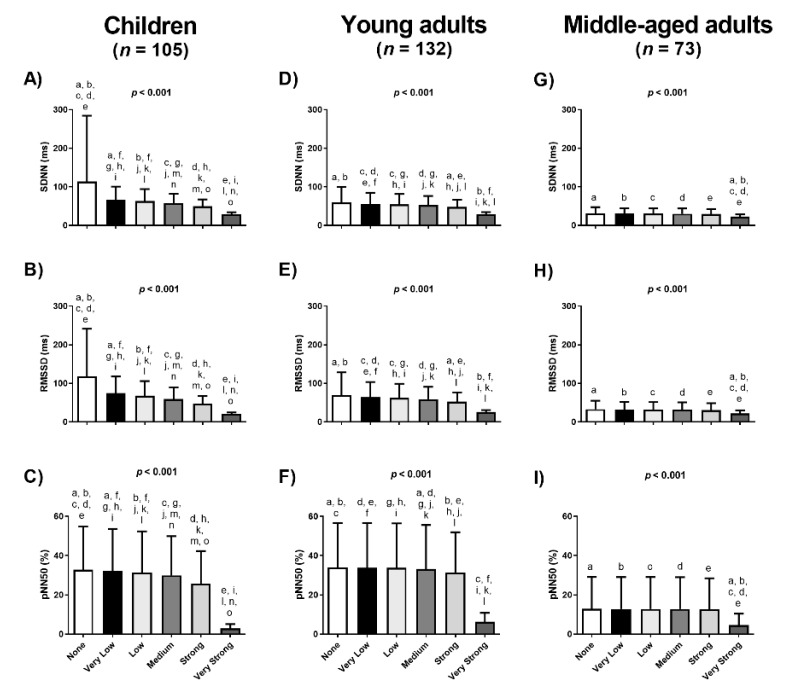
Figure 2.
Differences on the Heart Rate Variability (HRV) time-domain parameters using different Kubios filters in three different cohorts. Data are represented as mean and standard deviation. SDNN: standard deviation of all normal R–R intervals (Panels A, D and G); RMSSD: squared root of the mean of the sum of the squares of successive normal R–R interval differences (Panels B, E and H); pNN50: number of pairs of adjacent normal R–R intervals differing by more than 50ms in the entire recording (Panels C, F and I); p value from the ANOVA comparisons; similar letters means Bonferroni post-hoc differences.

