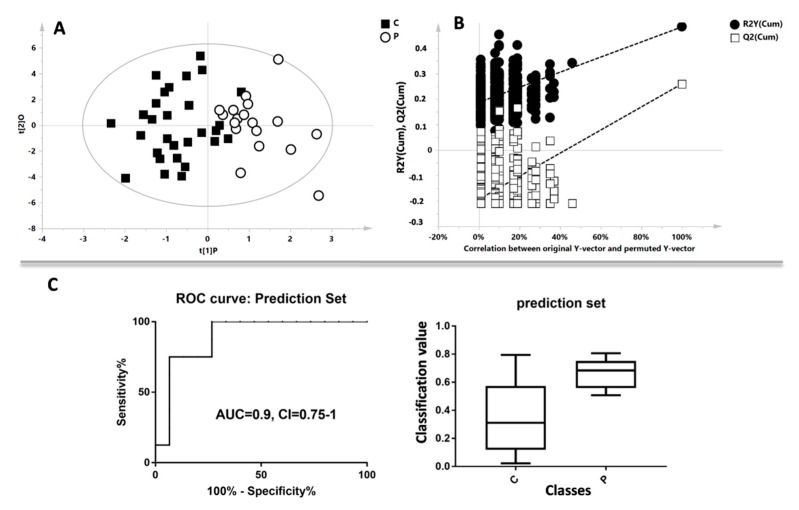
Figure 2.
Multivariate analysis between controls patients (C) and oligozoospermic patients (P). (A) Supervised Orthogonal Partial Least Square (OPLS-DA) model, black boxes represent the C class, while white circles represent the P class. (B) Permutation test of the OPLS-DA model. (C) Results of the prediction set analysis: ROC curve based on the cross-validated predicted Y-values, and the respective box plot.

