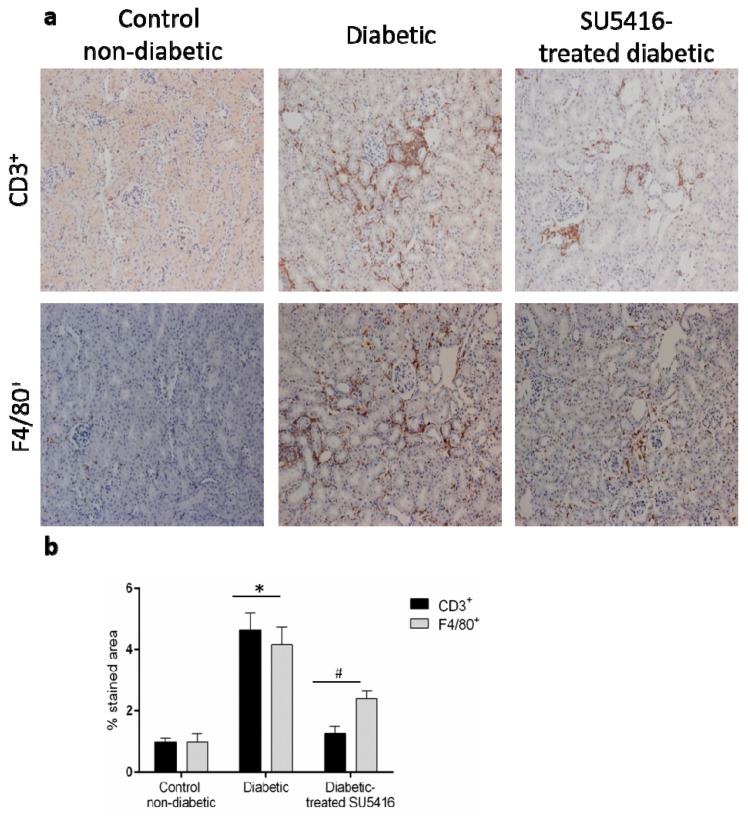
Figure 6.
A VEGFR2 blockade inhibited renal-inflammatory responses in the BTBR ob/ob experimental model. (a) Quantification of F4/80+, CD3+, and CD4+ cells as described in the Methods section, as an n-fold change of positive staining versus total area, normalized by values of control mice and data of each animal and mean ± SEM. (b) Representative images of the immunohistochemistry for non-diabetic, diabetic and SU5416-treated diabetic animals. Magnification ×200. Bars = 20 μm. Data as mean ± SEM of 6–8 mice per group. * p < 0.05 versus control non-diabetic, # p < 0.05 versus diabetic.

