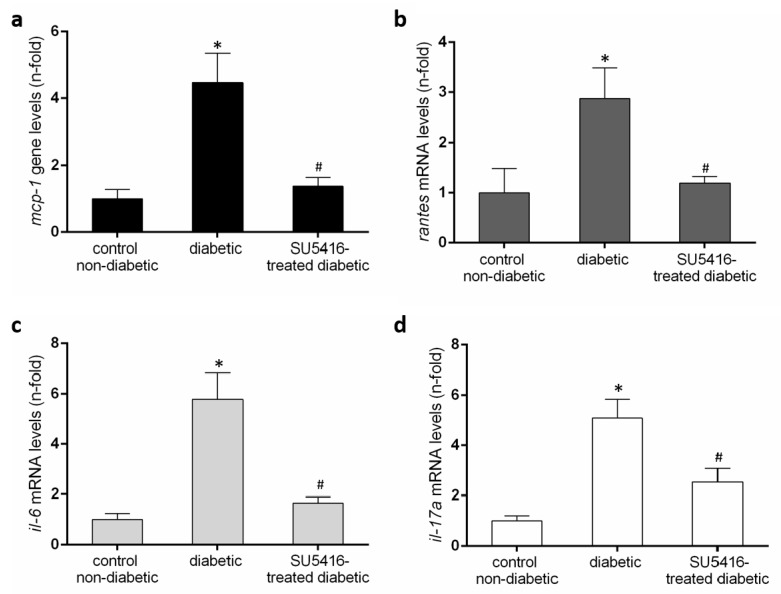
Figure 7.
Renal chemokines mRNA expression (a) monocyte chemoattractant protein-1 (mcp-1), (b) regulated on activation, T cell expressed, and secreted (rantes), (c) il-6 and (d) il-17a in each sample, normalized by cyclophilin 1. * p < 0.05 versus control. Data as mean ± SEM of 6–8 mice per group. * p < 0.05 versus control non- diabetic, # p < 0.05 versus diabetic.

